The Far (not Dark) Side of the Moon

On October 4th 1959, exactly two years after the launch of Sputnik, the Soviet Union launched Luna 3 to solve one of astronomy’s enduring mysteries.  You’ve probably never heard of it as it has since been overshadowed by the race to land a man on the Moon the following decade.  However, this four-foot probe gave humanity its first glimpse at the far side of the Moon.  And while it helped solve the mystery how the other side of the Moon looks, it opened up new questions to answer on the nature of the Moon.

Before we get into all that, it’s important to clarify one misconception regarding the Moon.  The far side, famous Pink Floyd album notwithstanding, is not the dark side of the Moon.  The far side is dark during a full Moon while the familiar near side is facing the Sun.  It is not dark during a new Moon when the near side is facing away from the Sun and the far side is facing towards the Sun.  That is after all, how images of the far side are obtained-when it is bathed in sunlight.

First image taken of the far side of the Moon. Credit: Luna 3-1, Russian Space Agency

When we look upon the Moon, the near side is divided into two types of regions.  The highlands are the bright regions and are quite old (4.5 billion years old) and heavily cratered.  The mare are darker, younger, and less cratered.  These regions formed some 3-3.5 billion years ago when large impact events occurred on the Moon, causing magma to flood the impact basin then solidifying into darker, basaltic plains.

The first images from Luna 3 were quite noisy but had enough resolution to determine the far side was mostly highlands.  As you might imagine, the Soviet Academy of Science gave the far side features Soviet orientated names.  The one major mare region was called Mare Moscoviense and the lava filled crater was dubbed Tsiolkovsky after the Russian rocket pioneer.

Tsiolkovsky Crater is 185 km (115 miles) wide and features a central peak 3200 m (10,500 ft) high.  This is a few hundred feet lower than San Jacinto Mountain in California.  As the crater has a smooth mare floor, it would make for a good landing spot and was a proposed, but eventually rejected, landing site for Apollo 17.  The central peak was formed by the rebound effect of the original impact.  You can see such a rebound effect if you drop an object into a glass of milk.  In the case of the crater, the uplifted rebound material solidified creating the central peak.

Tsiolkovsky Crater imaged by Apollo 17. Credit: NASA

The crater is named for Konstantin Tsiolkovsky, who in the early 1900’s, developed many of the theoretical underpinnings of modern rocketry.  He independently derived the ideal rocket equation relating a rocket’s change in velocity to the change in mass and thrust.  In 1929, he published his theory of multi-staged rockets.  His work was key to the Soviet Union’s initial burst into space.

Mare regions account for only 1% of the far side surface area as opposed to a third of the near side.  Both sides have had an equal amount of impacts during its history but the far side did not experience the upwelling of magma after these events.  The interior of the Moon is not symmetric.  The core of the Moon is closer to Earth and the near side.  As a result, the near side has a thinner crust than the far side.  It is thought this extra crust made it more difficult for magma to flood the surface on the far side after the impact events.

Interior of the Moon. Credit: NEEP

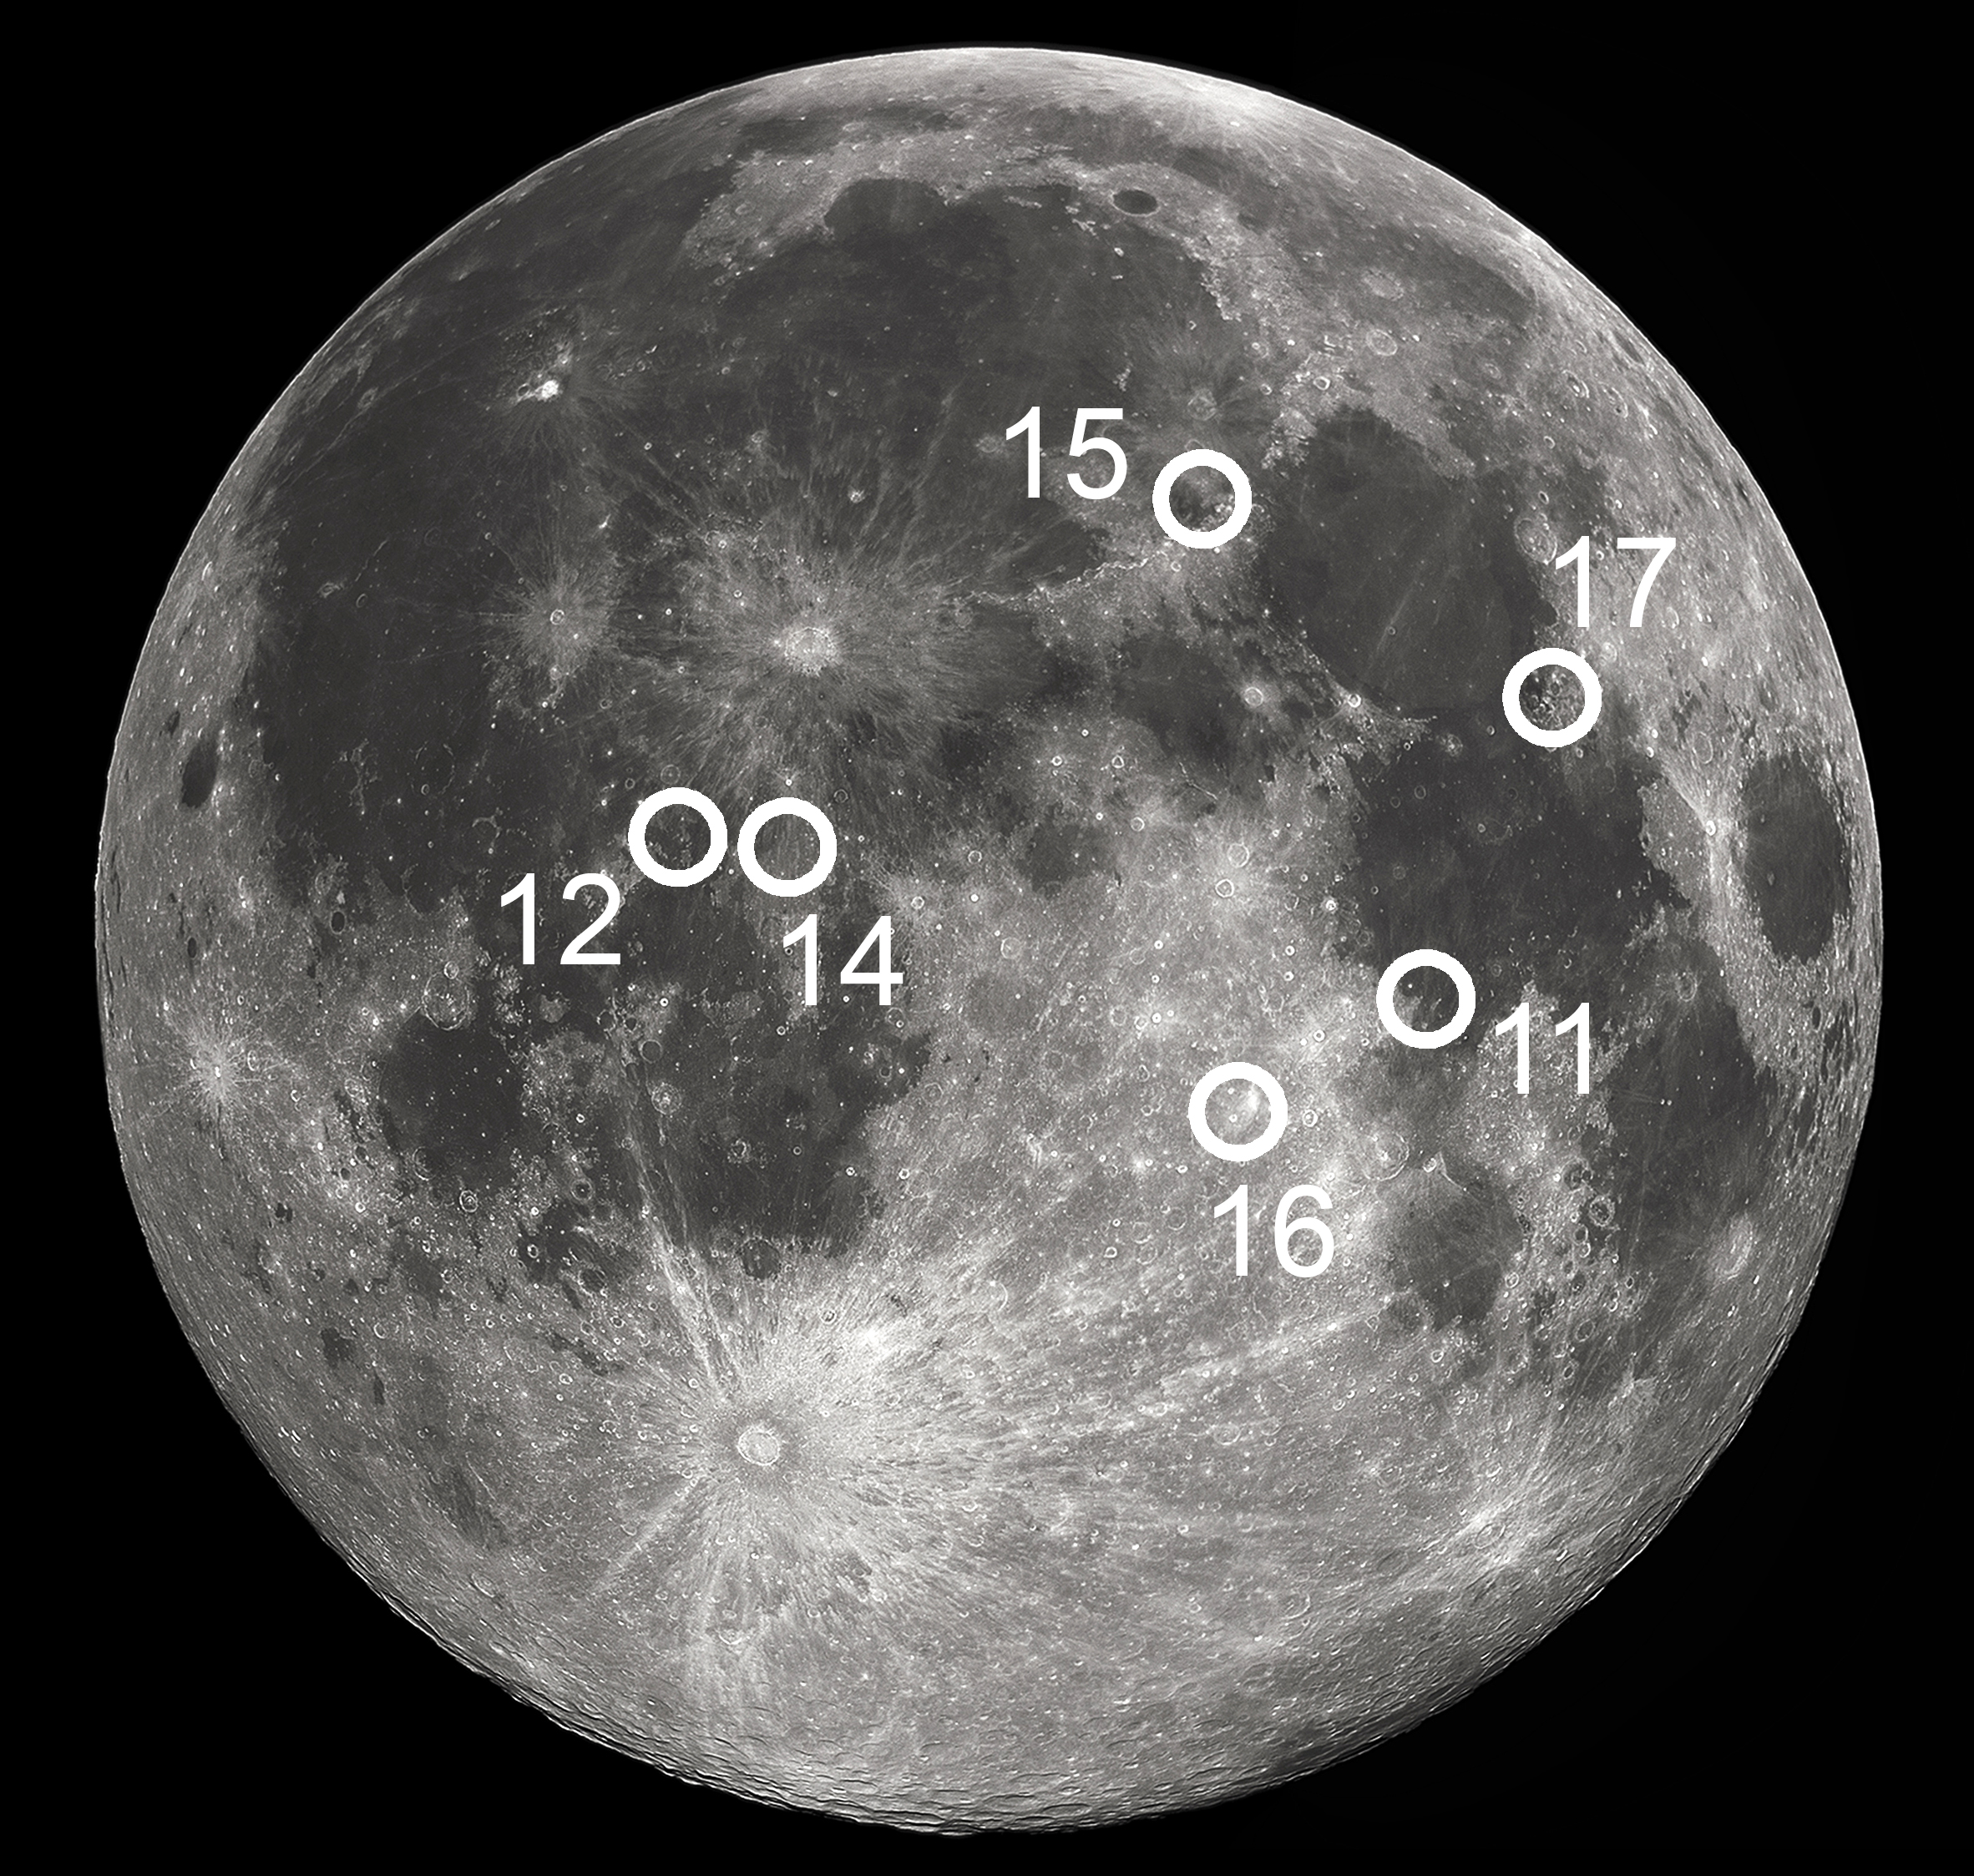
Only 27 humans in history have seen the far side personally.  Those would be the astronauts from the Apollo program that orbited and/or landed on the Moon.  All the Apollo missions landed on the near side although there was the proposal to land Apollo 17 on the far side.  No doubt, this would have provided rich scientific returns, but would have necessitated the cost of a lunar orbiting communications satellite.  As the Apollo program was winding down, this was deemed too expensive.  The Apollo program did provide some high-resolution images of the far side as seen below.

Far side of Moon taken by Apollo 16. Credit: NASA

After the Apollo program, there was a lull in lunar exploration.  A sense of been there, done that, pervaded the public mindset.  However, the lunar surface is four times the size of the United States.  The six Apollo landings covered a very small area and none of it was on the far side.  Exploration of the Moon would not resume until the 1990’s.  This modern phase would make some key discoveries on the far side, especially in the Polar Regions.

The presence of a large impact basin on the far side near the South Pole was suspected during the early 1960’s.  It was not until the Clementine mission in 1994 that the true extent of the basin was discovered.  The South Pole-Aitken Basin stretches some 2,500 km (1,600 miles-about the same from New York City to Cheyenne, WY)) from the South Pole to the Aitken crater.  The basin is five miles deep (five times deeper than the Grand Canyon) and is the second largest impact basin in the Solar System.  Only Hellas Basin on Mars is larger.

The basin is thought to have been created by a 170 km wide asteroid striking the lunar surface at 10 km/s.  To put this in perspective, the asteroid responsible for the dinosaur extinction was about 10 km wide.  From a scientific perspective, this basin is of interest as such an impact would uncover the deeper parts of the Moon’s crust.  Another aspect of interest is some parts of the basin are permanently shadowed.

South Pole and Aitken Basin (darker region) imaged by the Lunar Reconnaissance Orbiter. Credit: NASA/GSFC/Arizona State University

The Earth’s axis is titled 23 degrees from the orbital plane.  What this means at the poles is that the Sun at its highest point during the Summer Solstice is 23 degrees above the horizon.  The Moon’s axis is only tilted 1.5 degrees.  Thus at the lunar poles, the highest the Sun rises above the horizon is 1.5 degrees.  This is about how high the Sun is fifteen minutes after sunrise in the mid-latitudes on Earth.  As a result, a basin as deep as the Aitkin will have cratered sections that never see the light of day.  As the Moon has no atmosphere to distribute heat from daylight areas to dark regions, any water that collects in the basin will not evaporate.  And indeed, ice and water has been discovered in the basin near the pole.

Topography of the Aitkin Basin (lower right) relative to rest of the Moon. Credit: Brian Fessler and Paul Spudis, LPI

How does water get to the Moon?  The main suspect is the solar wind which transports hydrogen nuclei to the lunar surface.  Unlike Earth, the Moon does not have a magnetic field to deflect the solar wind away from the surface.  The hydrogen interacts with oxygen in the lunar soil to form water.  We typically think of oxygen as an atmospheric gas rather than something in rocks.  However, 47% of the Earth’s crust is oxygen in mass and 94% in volume.  Oxygen and silicon form chemical bonds quite easily and make up silicate oxides such as silicon dioxide (SiO2) and ferrous oxide (FeO) or iron as it is more commonly known.  The same is true of lunar soil and this provides oxygen to combine with hydrogen from the solar wind resulting in water.

Typically, water cannot exist on the lunar surface.  Any water would sublimate (transform directly from ice to water vapor) due to the lack of atmospheric pressure.  However, in areas without sunlight to start this process, water can exist on the surface.  Now, we’re not talking about lakes or seas here, the average amount of water comes out to one liter per ton of lunar soil.  The total amount of water on the surface is estimated as several hundred million metric tons.  And that is enough to extract and make human settlement on the Moon possible.  One possible site for a base would be Shackleton Crater at the South Pole in the Aitken Basin.  This site has the benefit of both sunlit and shadowed regions in close proximity of each other.

Blue indicates presence of hydrogen and most likely, water. Credit: NASA

Any talk of settlement on the Moon needs to include cost.  Currently, it costs about $10,000 to lift an ounce of payload from Earth.  Although companies such as SpaceX endeavor to bring that cost down with reusable rockets, it will still be quite expensive at this point for humans to migrate into space.  Utilizing resources on the Moon would be key for any permanent settlement.  Before we talk about space colonies, we need to take baby steps first.  This could include a rover and/or sample return mission to the far side followed up by human landings.  At that point in time, an assessment of the potential for a permanent presence on the Moon, whether it is on the near side, far side, or at the poles can be made.

Still, the far side is distinct enough compared to the near side that it definitely deserves a look into.  And while the idea of a human settlement on the far side seems pretty speculative today, consider this, sixty years ago no one had seen the far side.  In 2012, the GRAIL mission MoonKAM, a video instrument devoted to K-12 outreach, took the first video of the far side.  Whose to say what the next fifty years will bring?

* Image atop post is a look of the far side of the Moon with the Earth in the background from the DSCOVR satellite.  Credit:  NASA

Relativity and Planet of the Apes

“Seen from out here, everything seems different, time bends, space is boundless, it squashes a man’s ego.” –  Charlton Heston in The Planet of the Apes on the relativistic effects of traveling near the speed of light.

The Statue of Liberty just celebrated its 130th birthday which reminded me of the famous ending of the original Planet of the Apes.  For me, the beginning of this movie is important as it was the first time I had encountered the concept of relativity and time travel.  That is, time will move more slowly for a person in motion than for a person who is stationary.  This effect is not noticeable with the slow velocities in which we travel on Earth but becomes more pronounced when moving towards the speed of light.  And give Planet of the Apes credit, it gets it right, unlike say Star Trek, which often takes a cavalier attitude towards relativity for dramatic purposes.  The video below is the beginning two minutes where this plot device is introduced.

One caveat here, even during the height of the Mad Men era, NASA did not allow smoking during its missions.  The scientist mentioned, Dr. Hasslien, is a fictitious character.  The chronometer puts the ship year at 1972 but the Earth year at 2673.  By the time the ship lands, it is the year 3978.

So how does this premise work?  We can start by looking at Einstein’s time dilation equation:

Δt’ = Δt/[1 – (v2/c2)]1/2  where:

Δt’ = time elapsed on Earth

Δt = time elapsed on spacecraft

v = velocity of spacecraft

The exponent of 1/2 is another way of saying square root.

c = speed of light (3 x 10⁸ m/s or 186,282 miles per second)

When an object is stationary (v = 0) the denominator on the right side equals one.  Thus, Δt’ = Δt and both clocks run at the same rate.  As v approaches c, the term v2/c2 approaches 1.  This increases the value of the right side of the equation meaning Δt’ must increase to keep both sides of the equation equal.  Lets take a look at a couple of examples.

The velocity of the International Space Station is about 5 miles per second or 8000 m/s.  What is the time dilation effect of an astronaut who spends a year aboard the station?

Δt = one year or 3.15 x 10⁷ seconds

v = 8000 m/s

Plugging into the equation gives:

Δt’ = 3.15 x 10⁷ s/[1 – (8000 m/s)2/(3 x 108 m/s)2]1/2

Δt’ = 3.15 x 10⁷ s/[1 -(6.4 x 10⁷ m2/s2/9.0 x 1016 m2/s2)]1/2

Before the final calculation, a couple things to note.  You have to standardize your dimensions before calculating.  In physics, this usually means converting to meters/kilograms/seconds.  Not doing this is a common mistake for students taking their first physics course.  Also, the term m2/s2 cancels out leaving us with only seconds in the answer.  Since we are measuring time, checking dimensions will make sure you are on the right track. So, the answer is:

Δt’ = 3.15 x 10⁷ s/[1 -(7.11 x 10⁻¹⁰)]1/2

Δt’ = 3.15 x 10⁷ s (0.99999999964)

Δt’ = 31499999.99 s

So on Earth, our clocks advanced 31,500,000 seconds and the astronauts in orbit clocks advanced 31,499,999.99 seconds, so the ISS astronaut would have aged about 1/100 of a second less than us on Earth.*  What would happen if you were to spend a year traveling at  99% the speed of light?  Here, we can use fraction of light speed in the equation as the dimensions will drop out.

Δt’ = 3.15 x 10⁷ s/[1 – (0.98c/1c)]1/2  0.98 being 0.99 squared.

Δt’ = 3.15 x 10⁷ s/(0.02)1/2

Δt’ = 3.15 x 10⁷ s/(0.141)

Δt’= 223,404,255 s or 7.1 years

If we up the speed to 99.9% of light speed, Δt’ becomes 22.3 years.  To get the time dilation effect seen in Planet of the Apes you would need to travel about 99.99999% of light speed.  The graph below shows the time dilation effect with changing velocity.

Credit: Wiki Commons

You’ll note the time dilation effect does not show up significantly until you reach 40% of light speed or about 75,000 miles per second.  That speed would get you to the Moon in 3 seconds.  The effect has an upper bound at the speed of light.  That is, the time dilation effect approaches infinity as velocity nears light speed.  In fact, once you hit the speed of light, your clock would stand still.  And there’s no going back.  The time travel possibility is a one way ticket forward as going faster than light speed is required to move backwards in time.  In Einstein’s universe, nothing can travel faster than light speed.  The reason for this is mass increases when velocity increases.

Newton’s second law states that force is equal to mass times acceleration.  The assumption here is that mass is constant and thus, all the force results in accelerating an object.  Einstein discovered that as an object approaches light speed, mass is not constant and approaches infinity.  The equation to determine mass with velocity is as follows:

m = m0/[(1 – v2/c2)]1/2

m0 = rest mass

m = mass in motion

When velocity is 0, m = m0.  To apply this to the Planet of the Apes scenario, lets assume the mass of the space vehicle is the same as the Apollo command/service module at 15,000 kg (33,000 lbs).  If we accelerate to 99.99999% of light speed, its mass would increase to 33.5 million kg (74,000,000 lbs) or about 12 Saturn V rockets.  At this point, more force gets decreasing returns in velocity as the spacecraft’s mass increases and becomes more difficult to push.

The term (1 – v2/c2)1/2  is referred to as the Lorentz transformation and is frequently seen in special relativity equations.  For shorthand, is is often symbolized by γ.  Besides time and mass, length is also impacted by velocity and contracts as an object approaches light speed.  The Hyperphysics website has some nifty relativity calculators you can check out here.

Our first attempts to reach another star will not be in large starships such as the U.S.S. Enterprise of Star Trek fame.  More than likely, it will be in a fleet of tiny spacecraft such as proposed by Stephen Hawking for Operation Starshot.  Using nanotechnology, the goal is to send thousands of 20 gram (about 0.7 oz.) probes to our nearest interstellar neighbor Alpha Centauri.  Light sail technology would propel these vessels to 20% of light speed.  At this rate, the mass of each probe would only increase from 20 to 20.4 grams.  Even if velocity reached 80% of light speed, the mass increase would only be to a manageable 32 grams.  Having thousands of smaller probes rather than one large craft increases the odds that the mission reaches its final destination even if some get damaged along the way.

To sum it all up, the faster you move through space, the slower you move through time.  Also, motion brings about an increase in mass.  Both these effects do not become pronounced until you reach 40% light speed, which does not happen to us here on Earth.  Time stands still at the speed of light and mass approaches infinity as you close in on light speed.  This makes human travel to the stars very problematic.  Of course, in The Planet of the Apes, the crew basically made a round trip to Earth.  Charlton Heston discovers that when happening across the ruins of Lady Liberty.

Never did understand why all those apes speaking perfect English did not clue him in to that beforehand.

*If we were to delve into general relativity, gravity slows clocks the same as velocity does as seen in Interstellar.  This means being on a planet surface with greater gravity slows your clock compared to someone in orbit.  This offsets the velocity time dilation for astronauts in orbit.  Factoring the two, astronauts age about a millionth of a second less than us here on Earth.

**Photo atop post is the chronometer on Heston’s spacecraft.  Credit: 20 Century Fox.

Earth and Space

We tend to think of the Earth as apart from the rest of the universe.  That is natural as astronomy is the science of looking away from our home planet.  While there are many things in space we do not experience in our daily lives such as relativistic effects and black holes, there are other phenomena in space that are closely related to our day-to-day lives.  Some introductory astronomy texts lump the Earth and Moon in a chapter with all the other inner planets.  I think this is a mistake.  A separate section should be dedicated to the Earth and Moon as a starting point to understanding space.

There are many Earth to space examples to pick from and below I’ll describe a few.

I’ll start on the ground level.  The Earth experiences plate tectonics along with resultant earthquake and volcanic activity.  Lets take a look at shield volcanoes.  These volcanoes vent liquid lava rather than explosive pyroclastic material we typically associate with such events as the Mount St. Helens eruption in 1981.  Shield volcanoes are gently sloping (Hence, they resemble shields) as liquid lave runs downhill quickly preventing the buildup of steep slopes.  A prominent example are the Hawaiian Island chain situated above the Hawaii hot spot.  Why is there a chain rather than just one island?  As the Earth’s tectonic plate slides over the hot spot, a chain of islands are formed.

Shield volcano of Mauna Kea in Hawaii where the Keck Observatory sits at the summit. Credit: Wiki Commons.

The largest shield volcano in the Solar System is Olympus Mons on Mars.  This volcano stands 16 miles high (Mt. Everest is 5.5 miles high) and has a base the size of Arizona.  The low gravity of Mars, a third that of Earth, allows for the extreme height of Olympus Mons.  And why is Olympus Mons a single volcano rather than a chain like Hawaii?  Mars does not have plate tectonics as Earth does.  Hence, the crust of Mars never slid across the hot spot as the Hawaiian Islands did on Earth.  Understanding the nature of shield volcanoes on Earth can be integrated into an comprehension that Mars has smaller mass, thus, smaller gravity than Earth and no plate tectonic activity either.  Land features are not the only place to find planetary similarities.

Computer generated image of Olympus Mons using data from Mars Global Surveyor laser altimeter. Credit: NASA/MOLA Science Team/ O. de Goursac, Adrian Lark.

The rotation of Earth affects air circulation via the Coriolis effect.  In the Northern Hemisphere, air movement is deflected to the right.  In the Southern Hemisphere, air movement is deflected to the left.  What this means is in the Northern Hemisphere, low pressure systems rotate in a counterclockwise pattern.  You can see this in radar shots of hurricane systems which are massive regions of low pressure.  High pressure systems rotate in a clockwise pattern.  The pattern is reversed in the Southern Hemisphere.

Hurricane Mathew circulating in a counterclockwise fashion. Credit: NOAA.

Now lets take a look at Jupiter’s Giant Red Spot from this time lapse video of the approach of Voyager I in 1979.

Jupiter rotates in the same fashion as Earth.  That is, counterclockwise if looking down from the North Pole.  At first glance, the Giant Red Spot seems to resemble a hurricane and it might be easy to assume it is an area of low pressure.  However, it is in the Southern Hemisphere and rotates counterclockwise.  By understanding how the Coriolis effect works on Earth, you can deduce the Giant Red Spot is actually an area of high pressure.  Beyond this raging centuries old storm, understanding the nature of Earth’s magnetic field will help one understand the space environment surrounding Jupiter.

Most of the matter we encounter is electrically neutral.  That is, their constituent atoms contain as many negatively charged electrons as positively charged protons.  In space, the Sun is hot enough to break the atomic bonds between electrons and protons.  The result is an electrified gas called plasma.  Neon lights are filled with plasma.  When plasma encounters a magnetic field, it’s electrically charged particles travel along the path of a magnetic field line in helix pattern seen below.

Credit: cnx.org
Credit: cnx.org

This can be visualized on the Sun which has a more complex magnetic field than the Earth.  The Solar Dynamics Observatory images plasma traveling along the solar magnetic field lines in formations referred to as coronal loops.

Credit: SDO/NASA
Coronal loops.  Credit: SDO/NASA

Back on Earth, these charged particles move along the magnetic field lines until they hit the upper atmosphere in the polar regions.  Nitrogen and oxygen atoms absorb the kinetic energy of the incoming particles causing electrons to jump to a higher energy orbit.  When the electron moves back to its usual lower energy orbit, the absorbed kinetic energy is converted and released as light.  This light is known as the aurora.  Earth is not the only planet with an aurora, the gas giants have strong magnetic fields that produce the same effect, albeit mostly in ultraviolet.  This presents a good opportunity to understand that light and ultraviolet are both electromagnetic radiation.  The difference is our eyes are not designed to detect ultraviolet rays, but our skin can in the form of sunburn.  The aurora of Saturn as imaged by the Hubble can be seen below.

Credit: NASA/ESA/J. Clarke (Boston University).

Electrons, when accelerated, will emit radio waves.  This is the principle behind radio transmitters.  Electrons are accelerated up and down a radio tower causing the transmission of a radio broadcast.  The same thing happens in space when electrons are accelerated along the path of a magnetic field line.  Jupiter emits radio waves in this fashion that can be detected on Earth with ham radio sets.  This process plays itself out in the deepest regions of the universe.  For one such example, we’ll take a look a the galaxy Centaurus A located 12 million light years away.  Below is an optical image of the galaxy.

Credit: ESO
Credit: ESO

In 1949, it was discovered this galaxy was a strong emitter of radio waves.  Below is a radio image of Centaurus A.

Credit: NRAO/AUI
Credit: NRAO/AUI

The radio source emanates perpendicular to the mass of the galaxy.  Each lobe is a million light years long (10 times the width of the Milky Way) and would appear 20 times the size of a full Moon if we could see radio waves.  This suggests a massive stream of plasma being ejected from the galaxy.  What could cause this to happen?  In the core of Centaurus A resides a black hole 55 million times the mass of the Sun.

It seems counter-intuitive that a black hole could result in such a massive ejection of matter.  We think of black holes as objects that suck in everything, including light.  However, some of the matter in the accretion disk surrounding the black hole hits a magnetic field before crossing the event horizon.  So instead of continuing into the black hole, the plasma is accelerated and ejected violently along the magnetic field line exiting the galaxy.  Below is a composite image of Centaurus A with optical, radio, and x-ray imaging.

Credit: ESO/WFI (Optical); MPIfR/ESO/APEX/A.Weiss et al. (Submillimetre); NASA/CXC/CfA/R.Kraft et al. (X-ray)

There is a tendency to think of Earth science and astronomy as separate fields of study, but as we live on Earth we are also living in space – under the protective cover of the atmosphere.  The first step in understanding space is to learn the science behind what we experience in our surroundings.  From there, we can explore and understand the universe.

*Image atop post – Earth and the Milky Way from the International Space Station.  Credit:  NASA.

Rosetta’s Legacy

Dubbed broom stars by Ancient Chinese astronomers, comets have captivated humanity for centuries.  From our perspective on Earth, the ephemeral nature of these visitors in the sky were a source of great mythology.  The physical understanding of these objects began with Edmond Halley’s prediction in 1705 that a previously observed comet would return in 1758.  When the comet made its scheduled rounds that year, it became perhaps the most celebrated of celestial objects and was named after Halley.  Photography and spectroscopy beginning in the late 1800’s began to unearth the composition of comets.  In 2014, ESA’s Rosetta mission was the first to land a probe on a comet.  While comets are only short-term visitors in the night sky on Earth, they are relics from the formative era of the Solar System 4.6 billion years ago.

donati
Donati Comet over London, 1858. First photograph of a comet. Credit: William Usherwood

Rosetta was launched in 2004 and reached Comet 67P/Churyumov-Gerasimenko in 2014.  This comet is thought to have originated in the Kuiper Belt beyond Uranus and was gravitationally perturbed into an orbit that reaches just beyond Jupiter every 6.45 years.  Why did it take so long for Rosetta to reach its target?  The trajectory utilized three flybys of Earth and one of Mars to ramp up to the required velocity to get to the comet.  This saves fuel reducing weight lowering mission costs.  Along the way, Rosetta also flew by the asteroids 2867 Steins (in 2008) and 21 Lutetia before going into a 31 month deep space hibernation.  Below is a video of the complex trajectory of the Rosetta mission.

The presence of water is the key to life on Earth.  A crucial question is how did the water get here?  The early Earth was very hot, hot enough to boil water so it must have been delivered afterwards with the prime suspects being comets and/or asteroids.  Rosetta, named after the stone containing hieroglyphics that deciphered Ancient Egyptian writing, was hoped to have deciphered this part of the ancient Solar System history.  What it found was that the water on the comet was heavier than that on Earth.

If you are a World War II buff, you may have heard of heavy water.  This type of water has an hydrogen atom with an neutron in addition to the usual proton and is thus, heavier than normal water.  Heavy water can be used to produce weapon grade nuclear material and Germany had a program set up in Norway to do so.  A series of commando raids in 1942-43 by the Norwegian Resistance knocked these plants, and Germany’s nuclear ambitions, out of commission.

What Rosetta found was Comet 67P had three times the amount of heavy water isotopes than found on Earth, making this type of comet unlikely to have delivered water to Earth.  For now, asteroids seem to be the likely candidates but our sample size is still small and more work needs to be done to arrive at a definitive answer.

The other key to life is organic material.  Could comets have delivered organic material to Earth during the early bombardment phase of its existence?  The mission lander, Philae, was tasked with detecting such material near or on the comet surface.  The landing did not go as planned as harpoons designed to keep Philae in place failed to deploy.  The lander bounced in the light gravity environment and settled in a shadowed region on the surface.  Although this caused Philae’s solar battery to shut down after 60 hours, the lander detected 16 forms of organic material.  This material, delivered to Earth billions of years ago, could have served as the precursor to the complex organic chemistry that produces life on Earth.

Philae lander located by Rosetta. Credit: ESA/Rosetta.

What Philae also found is that the surface of the comet was covered with about one foot of soft, dusty material over a hard ice surface.  Comets, despite the brightness of their appearance as they get close to the Sun, are actually among the darkest objects in the Solar System.  In fact, comets are darker than coal.  Keep in mind, coal is organic in nature, representing the end of the life cycle of plants on Earth some 300 million years ago.  When we study comets, we are studying ourselves and our origins.

In the final weeks of the mission, it was announced that the Rosetta orbiter detected organic material more complex than what Philae had found.  This discovery was made by spectroscopy performed on dust grains captured by Rosetta.  Rosetta and Philae would also work in tandem to analyze the interior of the comet.  Philae transmitted radio waves through the comet which were received by Rosetta.  An analysis of the radio waves indicated Comet 67P is porous and low in density.  The nature of the dust grains which are fluffy, rather than compacted, is the cause.  Gravity measurements by Rosetta indicated there are no underground cavities in the comet.

Rubber duck shape Comet 67/P. Credit: ESA/Rosetta.

And the gravity field of Comet 67P was quite complex.  Gravity fields around spherical objects are fairly predictable to orbit.  However, Comet 67P has what is now known as a rubber duck shape.  This made Rosetta’s orbital maneuvers tricky.  It was determined that the rubber duck nucleus was caused by a slow collision of two comets that eventually stuck together.

This just a summary of Rosetta’s discoveries.  I would recommend visiting the Rosetta website for the whole shebang.

While it is a sad event, especially for the mission ops team, it’s not the end of the story.  The data sent back by Rosetta will be analyzed for years to come and certainly more discoveries will be made.  The Mercury Messenger mission ended in similar fashion in 2015 and it was announced this week its data indicated Mercury was still shrinking.  In announcing its discoveries, Rosetta had an innovative social media team including a series of great educational animations for children promoting public support for the mission.

Watching the end of Rosetta reminded how different it was during the 1980’s when the mission was first conceived.  Back then, you did not get live updates of planetary missions.  What you got was maybe a couple minutes on the nightly news and an article in the newspaper the following day.  Rosetta was hatched during a difficult time for space exploration.

The global recession of the early 1980’s was not as bad as the Great Recession, but bad enough.  Unemployment spiked over 10% both in America and Europe.  At one time, the Reagan administration considered axing NASA’s planetary program including Voyager, before it had reached Uranus.  Fortunately, that did not happen, but there were no planetary missions launched from 1977 to 1989.  We face a similar lull in outer Solar System exploration as both Cassini and Juno will end their missions in 2017 as Rosetta did today.  That lull is a result of funding cutbacks after the 2008 financial crisis.  While Solar System exploration will not come to a standstill, the budgetary cuts of the early 2010’s scaled back missions that would have been launched in the next few years.

If all good things come to an end, the same is true of all bad things.

I remember during the late 1980’s and early 90’s the future plans for space exploration including the Mars Rovers, the Venus Express, and Cassini which I got to see being built at JPL.  This, along with the Great Observatories program, motivated me to return to school and study astronomy.  Little did I know back then I would deliver the results of these missions in same day’s time via the internet to my future students.

A new generation of scientists are planning missions to go Europa, Ganymede, and Jupiter.  These missions will not launch until the 2020’s and it may not be till the 2030’s when they reach their targets.  I look forward to presenting those mission results to a new generation of students just as I have with Rosetta.

* Image atop post is from Rosetta final outreach animation.  Credit:  ESA/Rosetta 

The Vastness of the Universe

Maps of the universe can understate the sheer vastness of space.  Even when distances are to scale, the size of celestial bodies are overly large and for good reason.  If the size of the objects were true to scale, they would be too small to see.  To get a grasp of the true nature of space, I am going to scale various systems using 10 miles as a base.  This is still pretty large but as the average commute in the United States is about 10 miles, this is a scale that is familiar in our day-to-day lives.

We’ll start with the Earth-Moon system.  The Moon is on average 238,855 miles from Earth.  Here, we’ll put the scale at 1 mile = 24,000 miles.  So, if we shrink the Earth and Moon to this scale, Earth will sit in the center while the Moon resides 9.95 miles away.  How big is the Earth?  The diameter of the Earth would be 1741 feet, about 100 feet less than the CN Tower in Toronto.  The troposphere, the lowest layer of the atmosphere where weather occurs and humans live, would only extend about 20 inches above the surface.  Here, you can see why astronauts comment on how from space, the atmosphere appears as a fragile protective layer that just hugs the Earth’s surface.  The upper layers of the atmosphere extend out 66 feet above the surface.  Also at 66 feet, you’ll find the Hubble Space Telescope.  The drag from the tenuous upper atmosphere will be enough to bring the Hubble down to Earth in the 2020’s just as happened to Skylab in 1979.  Here, you can appreciate the accomplishment of the Apollo program which traveled, on this scale, 9.95 miles to the Moon as opposed to 66 feet to reach Earth orbit.

Next up is the Solar System.  We’ll change the scale to 1 mile = 1 billion miles.  At this scale, the distance from the Earth to the Moon shrinks to 15 inches.  The Earth itself is half an inch or about the size of a marble.  In this model, we’ll put the Sun at the center and the table below will show what the Solar System looks like at this scale.

Object Diameter Distance from Sun
Sun 4.75 feet
Mercury 0.19 inch 190 feet
Venus 0.48 inch 354 feet
Earth 0.50 inch 491 feet
Mars 0.27 inch 748 feet
Asteroid Belt 0.01 – 0.03 inches 1080 to 1570 feet
Jupiter 5.50 inches 0.48 miles or 2,550 feet
Saturn 4.59 inches 0.89 miles or 4,688 feet
Uranus 2 inches 1.8 miles
Neptune 1.94 inches 2.8 miles
Pluto 0.09 inch 3.67 miles
Kuiper Belt 0.001 to 0.09 inches 2.5 to 4.5 miles
Voyager I & II

12.5 & 10.3 miles

On this scale, a trip to the Moon is 15 inches, to Mars some 250 feet.  As NASA people like to say, Mars is hard.  Going from the Moon, to the planets, and as we’ll see, to the stars each involves an exponential leap.  The Voyager missions, in space since 1977, have just reached the outer edges of our 10 mile map.  Note how much more massive the Sun is compared to the planets as it contains 99% of the mass in the Solar System.  Also note how tiny the asteroids are and on this scale, there is an average of 38 inches of separation between the objects in the asteroid belt.  Contrary to what you see in many sci-fi stories, there is plenty of space in an asteroid belt to navigate through.  Beyond the asteroid belt lie the gas giants.  This region was far enough from the Sun and cold enough to allow hydrogen compounds to freeze and utilize the abundant hydrogen in the solar nebula to form these giant planets.  In turn, the gas giant Jupiter’s gravity disrupted the formation of a planet in the asteroid belt.

Now, we’ll examine our neck of the woods in the Milky Way by taking a look at a region 10 light years from the Sun.  On this scale, we’ll put 1 mile = 1 light year.  Maps of our stellar neighborhood are not as ubiquitous in grade school as the Solar System so below is a look at our closest neighbors.

The Closest stars
Stellar Neighborhood 12.5 light years from Sun. Credit: Richard Powell

This region is embedded in what is called the Local Bubble, a peanut shaped area 300 light years across marked by tenuous, hot stellar gas.  It is thought that a series of supernovae 10-20 million years ago cleared out much of the interstellar gas in the Local Bubble.  On this scale, the solar system shrinks to 9 feet and the Sun is the size of a grain of sand.  The nearest star, Proxima Centauri, would be 4.24 miles away.  So, the leap from a Voyager type mission to visiting the nearest star on this scale is 9 feet to 4.24 miles.  The brightest star in the night sky, Sirius, would be 8.6 miles away.  Wolf 359 is not visible to the naked eye, but known to Star Trek fans where Star Fleet is destroyed by the Borg, would lie 7.8 miles away.  Galaxies often collide, but because of the spacing, stars rarely do.  This is key due to an impeding event to occur to the Milky Way in a few billion years.

https://upload.wikimedia.org/wikipedia/commons/5/57/5_Local_Galactic_Group_%28ELitU%29.png
Credit: Andrew Z. Colvin/Wiki Commons

The Local Galactic Group consists of some 54 galaxies clustered within 10 million light years.  Most are small, dwarf galaxies.  Here, we’ll use the scale 1 mile = 1 million light years.  The Milky Way would be 1/10th (528 feet) of a mile wide.  The Solar System lies 137 feet from the center of the Milky Way and is 0.0001 inches wide, about 1,000 times thinner than a human hair.  The closest galaxies to the Milky Way, the Magellanic Clouds, lie about 830 feet away.  The Andromeda Galaxy (M31), would be 2.5 miles away.  The Andromeda galaxy is larger than the Milky Way and would span over 1,100 feet across.  Compare this to the size and spacing to stars.  Galaxies are much larger and tend to collide into each other.

Until the 1920’s, the Milky Way was the only known galaxy.  Other galaxies were observed but were thought to be spiral nebulae within the Milky Way.  Edwin Hubble, working at Mt. Wilson, was able to resolve stars within the Andromeda Galaxy and determined it was situated beyond the Milky Way.  Taking measurements of other galaxies, Hubble also discovered the universe was expanding causing galaxies to race away from each other.  When galaxies are close enough, at times the gravitational attraction to each other is greater than the effect of the expansion of the universe.  The result is a collision between galaxies such as below.

https://i0.wp.com/apod.nasa.gov/apod/image/1210/NGC2623_HLApugh.jpg?resize=660%2C420
NGC 2623, two colliding spiral galaxies. Credit: Hubble Legacy Archive, ESA, NASA

The same will happen to the Milky Way and Andromeda galaxies in a few billion years.  Stars will not collide but some may be ejected in the process.  The end result is the two galaxies will merge to form a giant elliptical galaxy.

Galaxies are not the only objects to collide in the universe, galaxy clusters also can collide.  Some 150 million light years away (or 150 miles using the current scale) lies the Great Attractor.  This region lies behind the center of the Milky Way and thus, is not open to optical observation.  It is hoped that infrared and radio observations, which can peer behind the veil of dust at the galactic center, can someday provide details what the Great Attractor is.

The largest structures in the universe are galactic superclusters.  The Milky Way and Local Group reside in the supercluster Laniakea which is some 520 million light years in length.  Superclusters form filament type structures with large voids in between.

https://i0.wp.com/www.nasa.gov/images/content/228352main_cosmicweb_HI.jpg?resize=660%2C591
Credit: NASA, ESA, and E. Hallman (University of Colorado, Boulder)

To get a proper perspective on our home supercluster, lets use a scale of 1 mile = 50 million light years.  On this scale, Laniakea stretches out the entire 10 miles.  the Local Group of galaxies would be 1/5 of a mile (1,056 feet) wide.  The Milky Way would be about 10 feet across.  And as we can see from the image above, Laniakea is just a small part of the web of superclusters throughout the universe.

I have heard many students after taking an astronomy course say that it made them feel like an ant.  I remind them of what Fritz Zwiky said – each person in this vast universe is unique and thus, irreplaceable.  And that is of no small significance.

*Image atop of post is the Milky Way from the delicate arch in Natural Bridges National Monument in Utah.  Credit:  Jacob W. Frank/National Park Service

No, Vaccines Do Not Cause Autism

Recent misgivings expressed by Green Party presidential candidate Jill Stein on the safety of vaccinations has created another round in the vaccine/autism debate.  I use the word debate loosely here as we’ll see, there really should not be a debate at all on this topic.  In all fairness, Stein expressed concerns over potential industry capture of vaccine regulators, but that concern has been shot down effectively and some view this as merely a dog whistle for anti-vaxxers.  To be clear on this, the purported link between vaccines and autism is simply a case of scientific fraud and should be reported as such without mitigation.  However, once an idea, even a fraudulent one is let loose, it is very difficult to dislodge from the public mindset.  And that presents an arduous challenge for educators and policy makers alike.

The case for linking autism with vaccines began with the 1998 paper authored by Andrew Wakefield and 12 others stating their case.  Serious reservations regarding the research was expressed shortly after its publication.  The study had a small sample size and relied too heavily on parents recollections rather than hard data.  As is the case for scientific protocol, attempts were made to replicate the results of the Wakefield study.  In 2004, an extensive report by the National Academy of Sciences refuted any link between vaccines and autism.   The Center for Disease Control has followed up with nine studies confirming the National Academy of Science’s report.  As it turned out, there was a reason the Wakefield study was not confirmed.  The Wakefield report was not just bad science, but a fraud perpetrated to cash in on a potential lawsuit against manufactures of vaccines.

Wakefield
This is how the original paper purporting a link between vaccines and autism now appears on the Lancet website.

In 2011, the medical journal BMJ issued a retraction of the Wakefield study bluntly titled, Wakefield’s article linking MMR vaccine and autism was fraudulentAnd the retraction is damming.  Among the charges are:

“Is it possible that he (Wakefield) was wrong, but not dishonest: that he was so incompetent that he was unable to fairly describe the project, or to report even one of the 12 children’s cases accurately? No. A great deal of thought and effort must have gone into drafting the paper to achieve the results he wanted: the discrepancies all led in one direction; misreporting was gross.”

The BMJ also published an article by journalist Brian Deer that exposed Wakefield’s motivation for engaging in the fraud.  As it turned out, the medical records for all 12 children in the study were falsified.  The motive?  Wakefield was receiving compensation by a law firm to provide research that could bring a favorable result in a lawsuit against vaccine manufactures.  The compensation amounted to £435,643 ($700,000 in 1999).  And the damage done?  In the UK, the vaccination rate for measles, mumps, and rubella (MMR) dropped to 80% by 2003.  Fortunately, that has rebounded back to 92%.  In the United States, vaccination rates held steady between 90-92%, but geographical pockets of low immunization rates put children at risk of acquiring easily avoidable diseases such as the 2015 measles outbreak in Southern California.

So how could such a fraud still be considered a legitimate topic to debate in some quarters?  The answer lies in confirmation bias.  Science works by matching theory with data.  Sometimes, the theory comes first and is later proved by experiment.  This happened with James Clerk Maxwell’s theory of electromagnetism developed in 1867 and proved correct with the discovery of radio waves in the late 1880’s.  Sometimes the data comes before a theory is devised to explain it as the case with dark energy discovered in 1998.  Astrophysicists are currently attempting to devise a theory to describe the accelerated expansion of the universe caused by dark energy.  Sometimes both, as in the case of general relativity published by Einstein in 1916.  Einstein’s theory solved the existing problem of Mercury’s orbit that Newton could not, but had to wait until the Eddington Expedition in 1919 to prove space-time could bend light waves.

The key point here is that in science, a theory or model of a physical process must match the experimental data or it is wrong.  If an experiment cannot be devised to prove a theory, such as currently the case with string theory, it is simply unproven until such an experiment is produced.  However, those not trained in science tend to construct understanding via a narrative.  In the case of autism, the vaccine issue fills a gap in the narrative that science presently does not, that being an understanding how to prevent it.  And once a narrative is constructed, confirmation bias develops when facts that go against the narrative are rejected which is the opposite of how science works.  So how to go about getting the facts out?

To begin with, especially in a classroom situation, do not belittle the other person.  Doing so only motivates retrenchment.  This is why arguments are rarely, if ever, resolved on social media.  Once the insults start flying, forget about it.  In the class, it is important for each student to feel they have a fair role in the discussion.  For example, if a student holds creationist beliefs, I point out the father of the Big Bang really was a father, that is, Fr. Georges Lemaitre who was both a Catholic priest and astrophysicist responsible for conceptualizing the Big Bang by analyzing relativity theory.  Holding religious beliefs does not preclude someone from appreciating science and in the case of Lemaitre, performing scientific work at a high level.  In the case of vaccinations, expressing an understanding the other side’s concerns with a serious children’s health issue can go a long way in creating a constructive dialog.  The public generally does not read medical journals and the media, in some quarters, has been irresponsible in its reporting leading to the construction of a false narrative.

Once the student understands you are giving them a place at the table in the debate, go over the scientific method once again.  In a one off argument this is a bit difficult and thus, is something that is to be emphasized throughout the course.  Theory must meet experimental data which must be independently confirmed.  Over the course of time, the goal is to move a student from an ideological to a scientific mindset.  Doing so will open the student up to being more receptive to data that contradicts a previously held belief which in turn can reduce confirmation bias.  And sometimes, it is best to acknowledge science does not currently offer an explanation.  In the case of autism, we have to admit we do not know what its cause is rather than allowing a charlatan to fill a gap in a narrative.

On the other hand, those such as Andrew Wakefield, who have perpetuated this myth with the intent of monetary and/or political gain, simply deserve to be rebuked and marginalized from any policy debate regarding vaccinations.

*Image atop post is polio vaccinations during 1954 in Kansas.  Credit:  March of Dimes.

Where Apollo Landed on the Moon

During the Apollo era, I remember gazing at the Moon to find the areas where astronauts were exploring at the time.  Even with the most powerful telescopes, we are unable to detect the flags and equipment left behind, but it still is an interesting challenge to pick out these spots and not a bad way to learn about the Moon as well.  Recently, the Lunar Reconnaissance Orbiter has been able to image these landing spots and made some discoveries that point to some other interesting potential landing regions should we return.

Apollo landing sites. Credit: Soerfm/Wiki Commons

The Moon is divided into two types of terrain, the highlands which are the bright regions and the maria which are the darker areas.  The highlands are very old, about 4-4.5 billion years and thus, heavily cratered.  This makes the highlands geologically rich but challenging to land on.  The maria are younger and thus easier to make a landing attempt as the terrain is smoother.  The maria were formed 3-3.5 billion years ago when large impacts flooded basins with lava eventually to solidify into the dark, iron rich basaltic surfaces we see today.  Maria is derived from the Latin word for seas which ancient astronomers thought these dark areas were.  Of course, there are no large bodies water to be found in the maria.  Like the first Apollo landings, a return to the Moon will likely begin in the maria and expand outward into more challenging landing zones.

Apollo 11

Neil Armstrong and Buzz Aldrin spent 21.5 hours on the lunar surface on the Sea of Tranquility.  Just before the famous Christmas Eve reading of Genesis by the Apollo 8 crew, William Anders noted the Sea of Tranquility was selected as a future landing site in order to preclude dodging mountains.  While there were not any mountains to dodge, there were several large boulders causing Neil Armstrong to take manual control of the lunar module, eventually finding a safe landing spot with 25 seconds of fuel to spare.  Apollo 11 returned 22 kg (48 lbs) of samples back to Earth.  As would be expected from landing in a mare region, the rocks were mostly basalt created from lava when the region formed.  There were also breccias which are smaller fragmented rocks fused together over time.

Apollo 11 landing site from 15 miles above the lunar surface. The foot trail to the crater right center is 50 m (164 ft) and was furthest Armstrong and Aldrin ventured from the lunar module. Credit: NASA.

Apollo 12

Launched during a rainstorm, the crew of Apollo 12 had to experience the adventure of getting hit by lightning before reaching orbit and proceeding to the Moon.  Like Apollo 11, this mission landed in a mare region.  The Ocean of Storms (or Oceanus Procellarum in Latin) was the landing site of Surveyor 3 in 1967.  NASA wanted to aim for a precise landing near Surveyor 3 and examine samples in this region which appeared younger than the Sea of Tranquility.  Astronauts Pete Conrad and Alan Bean made two excursions on the lunar surface reaching half a mile away from the lunar module.  The samples were mostly basalt and, as expected, were 500 million years younger than the Sea of Tranquility establishing a range for lunar volcanic activity.  The crew also visited the Surveyor 3 and retrieved its television camera which is currently on display at the Smithsonian Air & Space Museum.

Pete Conrad checks out Surveyor 3 with lunar module 600 feet away in the background. Credit: NASA.

Apollo 14

After the Apollo 13 landing was aborted due to an explosion in a service module oxygen tank, its intended landing site in the Fra Mauro formation was slated for the Apollo 14 mission.  This was the first landing to occur in the lunar highlands.  This region contains rocks ejected by the formation of the Imbrium basin and it was hoped to capture samples that originated deep under the lunar surface.  The plan was also to capture samples from the nearby Cone Crater but the rugged terrain prevented the astronauts from reaching the rim.  Alan Shepard and Edgar Mitchell collected almost 42 kg (92 lbs) of rock samples most of which were breccia formed by rocks fragmented by the impact event.  The crew did collect some basalts which clocked in at 4-4.3 billion years old, significantly older than the earlier basalts collected.  Apollo 14 also had perhaps the most humorous event of the program with Alan Shepard’s attempt to play golf on the Moon.

Apollo 15

Hadley Rille from space with circle denoting Apollo 15 landing site. Credit: NASA

Apollo 15 began the J-series missions for the program.  These missions were more ambitious with longer duration stays and with the lunar rover, the ability to travel longer distances from the lunar module.  Apollo 15 was the first landing to stray away from the equatorial region.  David Scott and James Irwin spent some 18 hours exploring the lunar surface and traveled 28 km (17 miles-compared to 2 miles on foot for Apollo 14) on the rover.  A major target was the Hadley Rille.  Rilles are sinuous features on the Moon thought to be ancient lava tubes whose ceilings have since collapsed.  Indeed, the rocks returned from this region were basaltic in nature.  By the time Apollo 15 landed on the Moon, the final three missions (Apollo 18-20) were cancelled due to budget cuts, meaning there were only two trips to the Moon left for the program.

The 300 meter (1,000 feet) deep Hadley Rille from the lunar surface. Credit: NASA.

Apollo 16

This mission was specifically designed to bring back samples from the highlands.  Landing in the Descartes formation, Apollo 16 would return 96 kg (211 lbs) of Moon rocks that would fundamentally alter our understanding of the highlands.  Previously thought to be of volcanic nature, the sample contained very few basalt rocks.  Instead, the samples were breccia in nature.  Rocks on the Moon are fragmented when impacts occur.  These fragmented rocks are then fused together to form breccia rocks by the heat caused by subsequent impacts.  The age of the highland are 4.5 billion years old.  This dates back to the origin of the Moon as it cooled from a molten to a solid state.

Charlie Duke takes a sample of permanently shadowed soil next to the large boulder named, appropriately enough, Shadow Rock. Credit: NASA

Apollo 17

As this was the final Apollo mission, a sense of urgency was placed on obtaining a high scientific yield.  At one point, a landing on the far side was considered but rejected as it would require the additional cost of a communication satellite.  The far side is often confused as the dark side of the Moon.  However, during the new Moon phase the far side is facing the Sun and experiences daylight.  The far side differs from the near side as it is mostly highlands and has very little maria regions as can be seen below.

Credit: NASA/Goddard/Arizona State University

The site selected was Taurus-Littrow Valley, a very geologically diverse region that required a precision landing.  For this mission, Harrison Schmitt was moved up from the cancelled Apollo 18 mission to become the first astronaut-scientist.  Three days after the only night launch of the Apollo program, America made its final Moon landing.  Three excursions extending 25 km (15 miles) brought back a haul of 111 kg (245 lbs) of samples including highland rocks ranging from 4.2-4.5 billion years old, basaltic rocks from the valley floor indicating volcanic activity about 3.7 billion years ago, and ejecta from the Tycho crater that was 100 million years old.  By lunar standards, the Tycho crater is a relatively young feature even though dinosaurs were walking on Earth when created.

Apollo 17 lunar rover at the edge of Shorty Crater. Near the rim there is orange soil that is titanium rich pyroclastic glass originated from 10 meters below the surface but was ejected during the impact event. Credit: NASA.

Lunar Interlude

The scientific phase of the Apollo program, which was to be 18-20, was cancelled by President Nixon as the economy began to experience its first bout of both high inflation and unemployment that would plagued the economy during the 1970’s.  Two of the unused Saturn V’s are on display at the Kennedy and Johnson Space Centers.  NASA began to develop the space shuttle and its planetary exploration program.  The public lost interest in lunar exploration as there was a sense of been there, done that.  However, the lunar surface covers an area 38 million square km (14.6 million square miles), about four times the surface area of the United States.  As NASA began to recommence unmanned lunar exploration in the 1990’s, the Moon began to offer some surprises.

Lunar exploration was started again in 1994 with the Clementine mission that globally mapped the Moon, in particular, the 15 km (9 mile) deep South Pole-Aitken Basin.  This was followed by the Lunar Prospector in 1998.  The Moon had been thought to be completely water free but the Lunar Prospector detected the presence of 300 million tons of water mixed in the soil at both polar regions.  How could water exist on the Moon?  The Moon’s axis is only tilted 1.5 degrees.  This means the Sun in these regions can only reach 1.5 degrees above the horizon, roughly the same as the Sun about ten minutes after sunrise in the mid-latitudes on Earth.  Hence, large craters remain in permanent shadow so that any water there will not evaporate into space.

Blue indicates regions on Moon where water may exist. Credit: NASA.

However, the Lunar Reconnaissance Orbiter (LRO), launched in 2009, discovered the presence of hydrogen beyond shadowed areas of the Moon.  The water could have been delivered to the Moon very early in its history via comets.  It is also thought the solar wind, which carries hydrogen, could interact with oxygen embedded in silicates on the surface to form water.  To be sure, we’re not talking lakes or even underground springs here.  The water amounts to about 45 parts per million, but given the cost to lift material from Earth into space (about $10,000 per ounce), any long-term settlement on the Moon will require the use of raw material situated there.  This gives some promise that the Moon could be used as a base to colonize space.

Above – LRO’s high-resolution tour of the Moon

NASA is currently developing the Orion crew module along with the heavy lift Space Launch System which will make an unmanned test run past the Moon in 2018.  The ultimate goal of this program is to land humans on Mars although a lunar program to test mission systems beforehand is not out of the question.  Going to the Moon is only a three-day hop compared to seven months for Mars.  Using the Moon as a testbed could make sense before making the leap to Mars.  It is often argued that unmanned missions are less expensive, and less hazardous than crewed spaceflight.  However, humanity is hardwired to explore and expand its presence.  That is how we expanded beyond our origins on the African continent across the oceans to all corners of the Earth.  Hopefully, in the near future, children will once again gaze at the Moon and ponder the about the people exploring our nearest celestial neighbor.

The Education of Albert Einstein

Most historic figures have myths attached to them and certainly Albert Einstein is no exception.  Among them, Einstein failed math in high school and did his famous work on relativity in “splendid isolation”.  After reading Walter Isaacson’s biography on Einstein, one can see the social influences that shaped Einstein in his early years and how it enabled him to make advances in physics that others could not.  And much of that is rooted in modern educational theory.

Jean Piaget’s research on child development concluded there are four stages of development.  The final transition usually occurs around age eleven when a child moves from a concrete understanding of the world to an ability to solve abstract and hypothetical problems.  The age this transition occurs can vary with each individual and also with the subject matter.  Contrary to the struggling student myth, Einstein began thinking in abstract terms at a very early age.  A compass given to Einstein at age five demonstrates this.  Rather than thinking of the compass in concrete terms, that is, a mechanical device that points north, Einstein conjectured on the invisible magnetic field that caused the compass to always point north.  And this trend continued in Einstein’s early life.

During the 1930’s, a Ripley’s Believe It or Not! column stated Einstein failed math in high school and has remained part of the Einstein lore.  Truth is, Einstein had learned calculus by age 15.  And physics?  Einstein was at a college level by age 11.  How did this myth begin?  More than likely from Einstein’s days as a student in Germany’s authoritarian educational system.  Einstein thought little of rote learning, and was not afraid to make his teachers aware of that.  In today’s parlance, that bit of acting out probably gave the impression of a troubled student.  So what was it in Einstein’s background that allowed him to advance so quickly in his studies?

The second pillar of modern educational theory is Lev Vygotsky’s theory of learning by social interaction.  Part of that theory is the concept of the zone of proximal development.  Here, a student is placed in contact with a more skilled partner to help master a subject.  In Einstein’s case, his parents provided the first zone of proximal development.  Hermann Einstein, Albert’s father, partnered with his brother Jakob building electric generators and lighting.  This surrounded Albert with a technical/scientific background from the get-go not unlike, say, Bill Belichick growing up in a household with a football coach as a father.  Pauline, Albert’s mother, was a pianist and Albert would play the violin most of his life to catch a break from physics.

Einstein plays the violin during the charity concert in the New Synagogue, Berlin, January 29, 1930. Credit: Institute of Czech Literature, Czech Academy of Science.

At age 10, Einstein was introduced into another zone of proximal development in the person of Max Talmud, a 21-year-old medical student who had dinner with the Einsteins weekly.  Talmud introduced Einstein to many subjects including geometry and Kant’s Critique of Pure ReasonTalmud’s greatest gift to Einstein may have been Aaron Bernstein’s 21 volume People’s Book on Natural ScienceBernstein encouraged constructive learning techniques, in particular, thought experiments such as what it would be like to ride along a light beam.  These thought experiments played a crucial role in Einstein’s relativity breakthroughs and his attempt to describe the theory to the public in his book, Relativity:  The Special and General Theory.

As one might imagine, Einstein raced out of Talmud’s zone of proximal development in short order.  Not unlike the first time a student realizes they have raced ahead intellectually of their teacher.  Nonetheless, Talmud served as a rich pipeline of learning resources for Einstein.  In some sense, Talmud was Einstein’s version of the internet without all the negative distractions.  This resource enabled Einstein to think in ways that provided insights to solve problems other physicists were not able to.  Young Albert Einstein also possessed a fierce streak of individuality.

Self-identity is typically formed during high school years, but can be delayed beyond college.  By all indications, Einstein’s self-identity was molded by his family and his ethnicity.  Of the four general parenting characteristics, the Einsteins would fall into authoritative (not to be confused with authoritarian).  This engaged parenting style typically endows a child with high self-esteem and confidence, which certainly Albert Einstein possessed.  As a Jew in Germany, Einstein was an outsider in German society (as Isaacson notes, only 2% of Munich’s population was Jewish) and this reinforced Einstein’s contempt for the German authoritative educational system.  The Swiss educational system was another story.

Aarau, Switzerland. Credit: Roland Zumbuhl/Wiki Commons

Fed up with Germany, Einstein moved to Switzerland at age 16 and spent a year at the Aarau Cantonal School.  This school favored a constructionist educational philosophy where students build their own knowledge rather than simply accepting what was told to them by an authority figure.  Part of the instructional technique at Aarau included an emphasis on visualization of mathematical concepts based on the ideas of Johann Heinrich Pestalozzi who also valued student individuality.  Einstein thrived at Aarau and its visualization techniques played a significant role in Einstein’s breakthroughs in relativity.

Einstein’s Aarau transcript. Grade scale is 1-6 with 6 being best grade. Credit: Wiki Commons. Translation can be found at: https://commons.wikimedia.org/wiki/File:Albert_Einstein%27s_exam_of_maturity_grades_(color2).jpg

However, Einstein’s professional academic career did get off to a slow start.  In fact, he was working at a Swiss patent office in 1905 when he published four landmark papers on special relativity, mass-energy equivalence (E = mc2) the photoelectric effect (proving light acts as particles as well as waves) and Brownian motion (which established the existence of atoms).  Einstein’s anti-authoritarianism during his college years at Zurich Polytechnic rubbed some of his professors the wrong way and he had difficulty obtaining good references.  This has led to the myth of Einstein working in “splendid isolation” during this time.  And in a sense, Einstein was isolated from the heavy hitters in physics.  However, this may have been a godsend as those heavy hitters made discoveries that pointed towards relativity, but lacked the creativity Einstein possessed to put all the pieces together.  In pursuit of this, Einstein found one more learning social component in Zurich.

The Olympia Academy founders Conrad Habicht, Maurice Solovine, and Albert Einstein. Credit: Wiki Commons/Emil Vollenweider und Sohn

Had Einstein been discussing the current problems of physics in academia after the turn of the century, he would have been hamstrung by the Newtonian concept of absolute time.  That is, clocks run at the same pace for every observer in the universe.  Einstein and a group of friends formed what they jokingly dubbed the Olympia Academy.  Of the many topics discussed during these weekly sessions were David Hume’s and Ernst Mach’s rejection of absolute time.  This skepticism of Newtonian absolute time is the linchpin of special relativity, which states the speed of light is constant to all observers in the universe and time is variable as a function of velocity (times moves more slowly the faster you go, reaching a standstill at the speed of light).  Special relativity also put the universal speed limit at light speed leading to general relativity, which redefined gravity as curvatures in space-time which ripple throughout the universe at the speed of light and not instantaneously via Newton’s gravitational fields.

So is there anything we can apply from Einstein’s education?

To begin, don’t expect your students to become Einstein – the human race is lucky to experience such a genius once a century.  Great disasters are usually the result of many little things going wrong, great successes require many little things going right.  Replicating Einstein’s education will not likely produce another Einstein anymore than putting a hockey stick in a child’s hand will make him a Wayne Gretzky.  But to continue the sport’s analogy, Red Auerbach expressed a coaching philosophy that his job was to help his players reach their differing levels of maximum potential.  To illustrate, I am the same height as Larry Bird and Magic Johnson, but my maximum potential as a basketball player is significantly lower.  Rather than concern myself with that, with proper instruction, I should focus on reaching my personal potential level.

For example, if a student is struggling putting the ball in the hoop, rather than give a wedgie George Costanza style, have the player perform a thought experiment Albert Einstein style.  Instead of traveling with a light beam, imagine moving along with a basketball headed for the rim.  Take two scenarios, a shot with a low arc and one with a high arc.  How does the hoop appear as you are headed with the ball towards it?  The ball with the high arc “sees” more area in the hoop to enter, increasing the odds of making two points.  It  might not make the child into Larry Bird, but will move forward into reaching their full basketball potential wherever that may fall.

Techniques such as this allows a student to internally construct knowledge and not simply take a teacher’s word for it.  And student’s can apply these techniques in other subjects.  Also, the social component of learning cannot be ignored.  Ridiculing, instead of providing instruction, for a poor performing student causes social isolation not only in that class, but can cascade throughout the educational experience.  All the educational resources in the world cannot help a student who is socially isolated.  And likewise, lack of community resources in the educational system can thwart good instruction.  Teaching someone to fish may keep them well fed, but it only works if they actually have a fishing rod to use.

To maximize a student’s potential a rich social experience is required where ideas are passed back and forth as well as contact with more experienced learners.  This does not stop after childhood.  As the great economist Alfred Marshall noted, inexperienced workers are more productive when teamed with more experienced workers.  This is also why industries tend to form geographic clusters such as Silicon Valley.  In fact, despite his disdain for Germany, Einstein moved to Berlin in 1914 as that was the center of physics on the continent.  The diaspora of Jewish scientists, including Einstein, in the 1930’s had the opposite effect of diminishing Germany’s physics research.  Also, adequate resources must be available to apply what is learned.  Can a student without computer resources expect to function well in today’s society?  Finally, do not burden the student with unrealistic expectations.  Focus on what the student can do, not what they cannot do, and use that as a base to build upon to reach their own level of maximum potential.

*Image on top of post is Einstein presenting a lecture at American Association for the Advancement of Science in Pittsburgh on December 28, 1934.  Credit:  AP/Public Domain.

Why Go to Jupiter?

At 11:53 P.M. EDT on July 4th, as the last of the fireworks begin to fade, NASA will be eagerly awaiting a signal from the Juno spacecraft that it has entered orbit around Jupiter.  This will commence twenty months of exploration of Jupiter’s polar regions which is the epicenter of the giant planet’s massive magnetic and auroral activity.  It will also signify the beginning of the end of NASA’s second wave of space missions to the gas giants that began in 1989 with the launch of the Jovian Galileo probe.  In September 2017, Cassini will cease operations with a decent into Saturn.  Five months later, Juno will meet the same fate as it plunges into Jupiter.  NASA’s exploration of the outer planets will go dark until the 2020’s.

Juno, named after the Roman goddess wife of Jupiter, was launched in 2011 and embarked on a 1.8 billion mile odyssey to the giant planet that included a flyby past Earth.  Why flyby Earth?  The pull of Earth’s gravity whipped Juno into sufficient velocity to reach Jupiter.  This maneuver, while more time-consuming, saves fuel and cost.  Not an insignificant consideration as Juno was hatched during an era of flatline budgets for NASA.  In all, the Juno mission will cost $1.1 billion or roughly the same as a NFL stadium.  Below is a video of Juno’s trajectory to Jupiter.

Normally, we associate planetary missions with spectacular imagery.  Juno does have a camera on board but that will be used for outreach purposes.  The science of Juno involves magnetometers and particle detectors.  Jupiter has a massive magnetic field that produces aurora activity several times the size of Earth and radio emissions as well.  Juno intends to use its measurements to study the interior of Jupiter which in turn will reveal the processes that drive its magnetic activity and origins.

Jupiter’s aurora was discovered in 1979 by Voyager I.  On Earth, the aurora is created by ionized particles embedded in the solar wind spiraling down Earth’s magnetic field lines towards the poles (charged particles will follow the path of magnetic fields).  Here, in the upper atmosphere, the ionized particles slam into oxygen and nitrogen atoms exciting their electrons to a higher energy level.  As the electrons subside back to a lower energy level, the kinetic energy of these particles are converted to electromagnetic energy in the form of green and red light.

Juno’s elliptical orbits will avoid zones of high radiation surrounding Jupiter. Credit: NASA/JPL/Caltech/Institute for Aeronautics and Astronautics

On Jupiter, the process is a bit different.  The solar wind contributes to the aurora, but there is another major source of ions from the moon Io.  The most volcanic active body in the Solar System, Io spews out oxygen and sulfur ions that travel along Jupiter’s magnetic field to the poles.  The aurora has been viewed by the Hubble which recently released this image.

aurora
Credit: NASA/ESA

When electrons are accelerated, radio waves are transmitted.  This is the principal that radio towers work on.  Electrons are accelerated up and down the transmission tower producing the broadcast received by your radio and converted to sound waves by its speakers.  Around Jupiter, electrons are accelerated as they spiral down the magnetic field lines.  Io also acts to accelerate electrons as its presence distorts Jupiter’s magnetic field. A change in a magnetic field induces an electric field pushing the electrons.  This action creates radio transmissions from Jupiter that are received on Earth in the 8-38 MHz range, the same range shortwave radio is transmitted.

Ham radio operators have received these transmissions from Jupiter and NASA’s Radio Jove project allows schools to purchase receivers for a few hundred dollars to detect Jupiter’s radio waves.    Samples of these radio observations can be heard here.

One might ask, why should we care about Jupiter’s magnetic field and how does it relate to Earth?  The answer lies in the fact that while we can map Earth’s magnetic field as it extends into space, we are unable to map the dynamo process generating the field in Earth’s interior.  Jupiter, being a gaseous planet, will allow Juno to map the magnetic field down to the interior where the dynamo lies.  Jupiter formed before the solar wind blasted away the primordial material of the solar nebula.  The more we learn about Jupiter’s interior, the more we’ll know how the Solar System originated.  The video below describes how Juno will explore Jupiter’s magnetic field.

Juno’s instrument package includes a radio transmitter to detect variations in Juno’s velocity as it orbits Jupiter.  Doppler shifts in the radio waves will allow for measurements of variations in Jupiter’s gravity field providing hints to the make up of its interior.  The Jovian Auroral Distributions Experiment (JADE) and Jupiter Energetic Particle Detector Instrument (JEDI-video below) will measure the ions and electrons traveling along the magnetic field lines that eventually produce Jupiter’s aurora.

The Jovian Infrared Auroral Mapper (JIRAM) will provide images of Jupiter’s aurora.  Juno’s magnetometer will construct a 3-D map of Jupiter’s magnetic field, both the field lines and their magnitude.  The Microwave Radiometer’s (MWR) function is to detect thermal radio emissions from six layers beneath the clouds of Jupiter.  This will provide a 3-D map of the Jovian atmosphere.  The Ultraviolet Imaging Spectrometer’s (UVS) mission is to examine the aurora in ultraviolet allowing for measurements on both the day and night sides of Jupiter.  The aptly named Waves instrument will measure radio waves produced by the magnetic field.  Last, but not least, is the JunoCam which will take the first pictures of Jupiter’s poles and allow for the public to participate on deciding other targets to image.

Image of Antarctica taken by JunoCam during Earth flyby. Credit: NASA.

On February 21, 2018, after completing 37 elliptical orbits of Jupiter, Juno will crash into Jupiter ending its adventure.  The next mission to the outer Solar System is not scheduled until the 2020’s with NASA’s planned Europa mission.  This gap was caused by funding curtailments created by the Great Recession.  This is similar to the gap between the Pioneer and Voyager missions launched in the 1970’s and the Galileo mission launched in 1989.  That first gap was caused by budget cuts during the Reagan administration in the 1981-82 recession. In fact, that gap almost became catastrophic as the administration proposed to terminate Voyager funding before the mission reached Uranus and Neptune.  Fortunately, Voyager was kept alive and is still returning data today.  So, what can we hope for in the meantime?

The Hubble Space Telescope will still take high quality images of the outer planets, and will be joined by the James Webb Space Telescope in 2018.  Of course, both have other mission objectives and are not dedicated to viewing the Solar System.  The next generation of ground telescopes featuring mirrors in the 30-40 meter range will be able to peer deeper with more detail into the Solar System, possibly mapping surface characteristics of Kuiper Belt objects.  New Horizons just received funding approval to visit the Kuiper Belt object 2014 MU69 beyond Pluto on New Year’s Day in 2019.  Despite the upcoming lull in deep space exploration, the future still looks interesting for planetary science.

*Image on top is workers testing the solar panel for Juno prior to launch.  Credit:  NASA.

Big Mo

During the nascent age of home computers, the Apple IIe football game Tuesday Morning Quarterback had a momentum indicator that fluctuated in favor of both teams throughout the game.  When momentum was on my side, short gains turned into long gains, touchdowns came easier, and life was good.  When on the opposition’s side, fumbles and interceptions became the norm and the odds of anything else going bad, along with my blood pressure rising, increased.  The concept of momentum in sports is well-known, lesser so, is the physics concept of momentum which has many application in sports and astronomy as well.

Momentum is defined as follows:

p = mv

Where p is momentum, m is mass, and v is velocity (both p and v are in bold as they are vectors with two quantities, magnitude and direction).  Thus, a marble rolling at 1 m/s has more momentum than a freight train at a stop.  And obviously, a freight train moving at 1 m/s has far more momentum than that marble at the same velocity.  A change in momentum over time also tells us how much force has been imparted on an object.  In more formal terms:

= dp/dt

In other words, force is equal to the rate of change in momentum divided by the rate of change in time.

Safer barrier after a NASCAR crash. Photo: Jared Smith/Wiki Commoms.

Safer barriers in auto racing use this concept.  Fatalities in racing used to be a fairly common occurence.  There were 37 fatalities during the first 57 runnings of the Indianapolis 500.  Improvements in auto design, head restraints, and the safer barriers have dropped those numbers considerably.  The safer barriers act as a cushion to soften the blow of a race car against the wall.  What the barriers do is prolong the time of impact.  Looking at the equation = dp/dt, doubling the time of impact reduces the force imparted on the race car by one half.  The amount of time of impact is small, we’re talking milliseconds here, but enough to dramatically increase driver safety.  Another sport is grappling with the same concept, but with an impact that occurs inside the body.

Chronic Traumatic Encephalopathy (CTE) is a degenerative brain disease found in football players.  CTE results in memory loss, aggression, and early dementia.  The disease is the result of repetitive concussive blows of the brain against the skull.  The brain has some protection against common bumps in the form of fluid inside your skull, but the fluid gives way when a violent blow, such as often occurs in football, is taken by the head.  In effect, the inside of your skull lacks a safer barrier in these instances.  This shortens the time of impact leading to an increase in force directed to the brain.  And here you can see how problematic this is for football.  You can’t insert a safer barrier inside the skull, the answers lie in changing the game in a manner that reduces these impacts.  Really, the only solution at this point is to eliminate contact in the game, something that would radically alter the nature of football which has become the most popular sport in America.

Momentum also plays a role in rotational movement, which is applicable to a much less violent sport than football.

Angular momentum (L) is defined as:

L =Iω

Where I = moment of inertia and ω = angular or rotational velocity.

I varies by the shape of the spinning object but is proportional to the radius.

As angular momentum is conserved, if the radius of an object is reduced, its rotational velocity increases.  Figure skaters use this principle to create rapid spinning movements in their routines.  As the skater begins to rotate, the arms are drawn towards the body to reduce radius and increase velocity.  You can try this at home on a swivel chair.  Have a friend spin you around with your arms outstretched, then pull your arms inward.  You will note the rate of your spin increasing.  Not as much as a figure skater does, but enough to notice.

Imparting a rotational force on an object is referred to as torque.  If an object is malleable, increasing its angular momentum by adding torque to it will cause it to flatten.  You’ll see this at your local pizzeria when the cook takes a blob of pizza dough and spins it in the air.  The blob becomes flattened into a pie shape that is then cooked in the pizza oven.  Beyond Earth, there are many applications of this principle.

Angular momentum flattens protoplanetary disk around the star HL Tauri Credit: ALMA (ESO/NAOJ/NRAO), Yen et al.

Our Solar System originated when torque was applied to an interstellar gas cloud.  This force most likely came from a nearby supernova.  As the gas cloud began to rotate, it flattened and commenced the process of constructing the Sun in the center and the planets in the disk.  This process has been observed in other planetary systems in the formation stage.  How spiral galaxies originate is not completely understood, but a galaxy’s angular momentum causes it to flatten into the classic spiral shape we see in so many space images.  When galaxies collide, the reverse of this process takes place.

The Antennae Galaxies/NGC 4038-4039
The The Antennae Galaxies/NGC 4038-4039 colliding. Credit: NASA, ESA, and the Hubble Heritage Team (STScI/AURA)-ESA/Hubble Collaboration

When two spiral galaxies collide, the odds of their angular momentum being in the same direction during the collision is slight.  Think of it this way, kids often start a whirlpool in a swimming pool by walking around the perimeter of the pool in the same direction.  This torquing action increases the angular momentum of the water in the pool.  If some other kids jumped in the pool and starting walking in the opposite direction, this torquing action offsets the original whirlpool, causing the rotation of the water to decrease.  This is essentially the same thing that happens to spiral galaxies when they collide.  The result is the two galaxies merge to form a giant elliptical galaxy with little rotation.  In essence, this is pizza effect put in reverse as the two flatten spirals form a blob shape.

And how does this apply to us?  Well, not us directly, but in a few billion years, the Milky Way will collide with its nearest large neighbor, the Andromeda galaxy.  While the two galaxies contain over a trillion stars combined, the odds of the Sun colliding with another star is slim.  That is a consequence of the large distances between the stars.  If the Sun was the size of a basketball, the nearest star would be 4,300 miles away.  However, the collision will eject stars from their respective galaxies and gravitational disturbances could cause incoming comets to collide with planets.  As this event will occur billions of years from now, the Sun will be nearing its red giant phase meaning Earth has become uninhabitable.  Humanity will not contend with this event unless interstellar travel has been achieved.  The video below is a computer simulation of the collision.

So momentum is not just a phrase tossed around in “horse race” punditry, but an actual physics concept with applications in our daily lives and the rest of the universe.

*Image on top of post is Mike Stratton’s tackle of Keith Lincoln in 1964 AFL Championship game.  The tackle was a momentum changer both in the physical and allegorical sense as the play turned the game in Buffalo’s favor.  Credit:  Wiki Commons.