It has often been said that newspapers are “history’s first rough draft.” The same is true of science. One could argue that journals fill the role, but historically, the vast majority of the public reads of scientific discoveries and/or events in the newspaper. It is quite interesting to see how these events were interpreted at the time without the benefit of hindsight. The New York Times online archive dates back to the paper’s origins in the 1850’s and represent a rich source of historical material that can be used in the class or for personal research. Here are some historical articles pertaining to astronomy and physics.
Auroral Phenomena– September 5, 1851. This article describes the aftermath of the Carrington Event, the most powerful magnetic storm in recorded history. The aurora was seen across America and telegraph operators could still send messages even after disconnecting the batteries. Below, NASA presents a computer model of the 1859 magnetic storm.
Glowing After – Sunset Skies – December 1, 1883. Three months after the Krakatoa eruption, the skies around the world appeared deep red after sunset as a result of aerosols ejected into the atmosphere. The cause of these sunsets were not known at the time – the article never refers to the Krakatoa eruption.
A Comet Visible by Daylight – September 20, 1882. The Great Comet of 1882, considered the brightest comet of the past 1,000 years, is visible during the day. The image atop this post is this comet. In 2015, the Rosetta mission became the first to attempt a landing on a comet.
The Roentgen Discovery – February 7, 1896. The discovery of x-rays and possible applications in the medical field. A century later, astronomers would use the orbiting Chandra X-Ray Observatory to discover the universe to be a violent place.
Wireless Signals Across the Ocean – December 15, 1901. Guglielmo Marconi receives radio signals in Newfoundland from London to open the era of mass communication. Decades later, astronomers use radio telescopes to discover pulsars and peer into the center of the galaxy.
The Greatest Telescope in the World – January 27, 1907.Plans to build a 100-inch telescope on the summit of Mt. Wilson in California. Opened in 1917, this telescope is where Edwin Hubble discovered the universe was expanding.
Mt. Wilson 100-inch telescope. Credit: Gregory Pijanowski
Comet Gazers See Flashes – May 19, 1910. Report on Earth passing through tail of Halley’s Comet. The comet tail was 100 degrees long and 10 degrees wide in the sky. Whatever was seen that night, comet tails are much too tenuous to cause flashes in the atmosphere.
Lights All Askew in the Heavens – November 10, 1919. Eddington Expedition proves Einstein’s General Relativity theory correct by measuring the bending of starlight during a total solar eclipse. Relativity has passed every test since, including the recent observation of gravity waves.
Nebula Velocities Support Einstein – June 12, 1931. Edwin Hubble discovers the expansion of the universe as predicted by Einstein’s relativity theory. Actually, Einstein was originally skeptical the universe could expand. It was Fr. Georges Lemaitre, Catholic priest and physicist, who proposed what was later called the Big Bang theory. The word nebula in the title refers to what we now call galaxies.
Lemaitre Follows Two Paths to Truth – February 19, 1933. Fr. Georges Lemaitre does not find a conflict between science and religion. Einstein and Lemaitre, “Have a profound respect and admiration for each other”. Article quotes Einstein as stating, “This is the most beautiful and satisfactory explanation of creation to which I have ever listened” regarding Lemaitre’s Big Bang theory.
Fr. Georges Lemaitre (center) and Albert Einstein, January 10, 1933. To the left is Robert Millikan who was the first to measure the charge of an electron. Credit: California Institute of Technology.
Bohr and Einstein at Odds – July 28, 1935. The conflict between relativity and quantum mechanics. The quest to unify the theory of relativity, which governs large objects, and quantum mechanics, which explains physics on an atomic scale, continues to this day.
Science and the Bomb – August 7, 1945. One day after Hiroshima, nuclear fission as a weapon and the implications for humanity are explained.
Mt. Palomar 200-inch telescope. Largest in the world from 1948-97. Credit: Gregory Pijanowski
Radio Telescope to Expose Space – June 19, 1959. Navy to build largest radio telescope in West Virginia. The current radio observatory in Green Bank, WV is surrounded by a 13,000 square mile (slightly larger than the state of Maryland) radio quiet zone, meaning no cell phones, radio, or microwave ovens.
New Clues to the Size of the Universe – March 26, 1963. The brightest objects in the universe, dubbed quasars, are discovered. Located over 10 billion light years away, these objects are so bright some astronomers thought they must reside within the Milky Way. However, further research would prove quasars to be the most distant objects observed by humans.
Signals Imply a Big Bang Universe – May 21, 1965. The discovery of the cosmic microwave background radiation (CMB) proves the universe was born in a hot, dense state aka the Big Bang. The CMB was most recently mapped by the ESA Planck mission. The map shows the state of the universe when it was 380,000 years old.
*Image on top of post is the Great Comet of 1882 from the Cape of Good Hope. Credit: David Gill.
When teaching astronomy to non-science majors, I try to make connections with the student’s field of study or personal interests. Sometimes this is not difficult. For example, I can discuss NASA budgets and cost estimating with business majors. For art majors, the deep red sunsets that followed the Krakatoa eruption of 1883 found their way into many paintings of the era. The most notable example of this was The Scream painted by Edvar Munch in 1893.
The Scream by Edvard Munch. National Gallery, Olso, Norway. Aerosols injected into the atmosphere by powerful volcanic eruptions can cause very deep red skies at sunset.
A while back, I talked with someone whose career was in the performing arts, specifically dance. I was stumped at the time to think of a possible tie in between astronomy and dance. The closest analogy I could come up with was the classic case of a figure skater demonstrating the concept of angular momentum during a spin such as below.
Angular momentum is conserved, that is, it is not created or destroyed (it can be converted to heat via friction). Angular momentum (L) is defined as:
L = mrv
m = mass, r = radius, v = velocity
As angular momentum is conserved, the value L is constant. In the case of the figure skater in the video, she reduces r by drawing in her arms and legs closer to herself. As the skater’s radius decreases, velocity must increase. Hence, the rate of spin increases as radius decreases. You can try this at home even if you do not know how to skate. Just find a swivel chair and have a friend spin you around with your arms extended, then draw in your arms close to your body. You’ll feel your spin velocity accelerate. Not as much as the skater, but enough to notice.
The conservation of angular momentum has several applications in astronomy, in particular, pulsars. Pulsars are the remnants of stars that went supernova. As the outer layers of the star are dispersed in the aftermath of a supernova, its inner core compresses forming the pulsar. In a pulsar, the gravitational force is so great that electrons merge with protons to form neutrons. Consequently, pulsars are a sub-class of what are known as neutron stars. As the radius of a pulsar is reduced, its spin rate greatly accelerates.
We can measure the spin rates of pulsars as they emit radio waves in the same fashion a lighthouse emits a light beam. The most famous pulsar is located in the Crab Nebula, which is a remnant of a supernova observed by Chinese astronomers in 1054. This pulsar spins at a rate of 30 times per second. To put that in perspective, the skater in the video above is spinning 5 times per second.
The pulsar in the Crab Nebula emits high energy x-rays. Red is lowest energy and blue highest energy x-rays. Credit: NASA/CXC/SAO
Is there any sort of analogy in the world of dance? Ballet dancers use the same method as figure skaters to increase their spin. However, as there is more friction from a wood floor than there is from ice, the effect is not as pronounced. Looking around I found a different approach when it came to this and found a connection, albeit allegorical, to the dance performance Vollmond.
Translated from German, Vollmond means Full Moon. Choreographed by Pina Bausch, the performance centers on two themes addressed in my class. One is scientific, how the full Moon increases tides, the other not so scientific, how a full Moon affects human behavior.
During a full (and new) Moon, the difference between high and low tides are at their greatest. During these two phases, the Earth, Moon, and Sun are aligned with each other. At this time, the effect of the Sun and Moon’s gravity is greatest on the oceans as can be seen below.
Credit: Wikipedia
The gravity from the Sun amplifies the lunar tides. During a full Moon, high and low tides occur twice a day. Tides during the full and new phases are referred to as spring tides. This has nothing to do with the season of Spring. In a way, it is during this time when the tides spring to life. When the Moon and Sun are at a right angle relative to Earth, the Sun’s gravity partially offsets the Moon’s gravity and modulates the tides so low and high tidal differences are not as great as the spring tide. These are referred to as neap tides. Local conditions can also amplify the tides. The most dramatic example of this is the Bay of Fundy where high and low tide can differ by 56 feet.
Spring tides at the Bay of Fundy Credit: Samuel Wantman/Wiki Commons.
So, if you live by the ocean, you’ll associate high tides with a full (and new) Moon. How about the Great Lakes? Not so much. The lakes greatest tide is only 5 cm, not enough to be noticed with the naked eye. The earth you stand on also feels the tidal pull from the Moon. Like the lakes, it is not noticeable at 25 cm. As the landmarks rise up and down with the ground, your eye cannot detect ground tides. We can say, quite confidentially, that the full Moon affects tidal motions. Can we say the same regarding human behavior?
The words lunar and lunatic have their roots in the Latin word luna. In ancient Rome, Luna was the goddess of the Moon. Lunatic means to be moon struck. We are all familiar with the phrase, “It must be a full Moon.” Meaning that the full Moon provides an explanation for an increase in bizarre/criminal behavior. Does the empirical evidence support this? The short answer is no. Studies have indicated no change in criminal behavior during a full Moon, or even a scientific model to explain why that would happen. This highlights the key difference between science and mythology.
Statue of the Roman Goddess Luna. Credit: Wiki Commons
Whenever a student writes the phrase, “I believe” in a science paper, I advise them to take pause and ask yourself why do you believe that? Science is not about beliefs, but about investigation of the nature and causes of phenomena we observe around us. If you want to assert something as being true in science, you need a model to explain why it happens, empirical evidence it actually does happen, and independent verification of the original results. Sometimes you might have a model you think is reasonable, but the empirical evidence does not back it up. One such case is in economics, where demand and supply curves indicate a minimum wage set above the market rate creates unemployment. The evidence does not support that meaning a newer, more sophisticated model is required to explain what is happening.
The purpose of this exercise was to find ways to connect a student’s personal interest to a scientific topic. If that can be accomplished, the chances of building the student’s interest and motivation in the class increases. In this case, we can use two situations to discern between what passes for science and what does not. For the teacher, it provides the opportunity to explore areas that were previously unknown. I would have never learned of the Vollmond dance performance without attempting to match my specialty with the student’s. It’s a good experience to reach out of your comfort zone to find common ground with your students. Often, in the classroom, who is the teacher and who is the learner can be a fluid situation. You have to permit yourself enter your current student’s world of interests. I have found that as a teacher, that prevents my lessons from going stale over the years.
*Image on top of post is the full Moon, or Vollmond in German. Credit: Katsiaryna Naliuka/Wiki Commons.
Some 1.3 billion years ago, as plant life was making its first appearance on Earth, two black holes 29 and 36 times the mass of our Sun, collided. The result of this collision was a single black hole 62 times the mass of the Sun. The remaining mass, equal to three Suns, was expelled as energy. This energy created a ripple in the space-time fabric referred to as gravitational waves. These waves, which emanated from the colliding black holes like pond waves formed by a rock tossed into it, were detected by the LIGO team on September 14, 2015. The announcement made today, culminates a 100 year effort by physicists to confirm Albert Einstein’s prediction of gravitational waves.
What are gravitational waves?
Issac Newton’s theory postulates that gravity acts as an instantaneous force throughout the universe. That is, the gravitational force from the Sun, Earth, even your body, is felt immediately on every other body everywhere. As Einstein worked up his theory of relativity, he knew there was a problem with this. According to relativity, there is a firm speed limit in the universe, this limit being the speed of light. As nothing, whether it is matter or energy, could travel faster than this, it would not be possible for the effect of gravity to travel faster than light as well. Clearly, a new way of explaining gravity was required.
Einstein found this explanation in the form of gravitational waves. If there was to be some sort of perturbation in the Sun’s gravitational field, we would not sense it right away on Earth. Instead, the disturbance would radiate from the Sun at the speed of light in the form of gravitational waves. It takes light eight minutes to reach Earth. Thus, a time lag of eight minutes would occur before we would feel the gravitational disturbance on Earth. In the same manner, there was a 1.3 billion year lag to detect the gravitational waves from colliding black holes located 1.3 billion light years away. Had Newton’s theory of gravity been correct, the gravitational effect of the colliding black holes, however faint, would have reached Earth instantly 1.3 billion years ago rather than last September.
I want to emphasize that Newton’s theory of gravity works in most situations. Newton’s predictions deviate from Einstein’s predictions in two key situations. One is when a body is located very close to a large mass, such as Mercury is to the Sun. The other is when a body is traveling near the speed of light. In other situations, Newton’s and Einstein’s equations yield the same result. In fact, NASA engineers will use Newton’s version of gravity when they can as it is easier to work with than relativity. The Apollo program, for example, sent humans to the Moon using Newton as a guide. Replicating Newton’s results where they are accurate was a key stepping stone for Einstein when devising relativity theory.
Another key stepping stone for relativity was making successful predictions where Newton could not. One such example is the orbit of Mercury. The perihelion (spot closest the Sun) of Mercury’s orbit advances 43 seconds of arc per century (43/3600th of a degree) more than predicted by Newton. This advance is visualized in exaggerated form below.
Credit: Wikipedia/Rainer Zenz
When Einstein found out that his theory’s solutions predicted Mercury’s orbit perfectly, he was so excited he experienced heart palpitations. As opposed to being a force, general relativity views gravity as a bending of space-time.
Earth bends space-time. Credit: NASA
As an object bends the space around it, another object will travel along the path of that curvature. Also, electromagnetic radiation such as light will follow the curvature as well. If an object accelerates, as when happens when black holes are colliding, it will generate ripples in space time. And it is these ripples that LIGO detected.
A 3-D visualization of gravitational waves generated by colliding black holes. Credit: Henze, NASA
The universe is not very pliable and it took a tremendous amount of energy to create these waves which are very small, only 1/1000th the size of a atomic nucleus. How much energy? Matter in the amount of 3 solar masses was converted into energy in the collision. Using Einstein’s famous equation:
E = mc2
E = 3(1.99 x 1030 kg)(3.0 x 10⁸ m/s)2
E = 1.79 x 1039 J where J = Joules
The Hiroshima atomic bomb released about 1014 J of energy. This means the black hole collision detected by LIGO released 1.79 x 1025 times the amount of energy as the 1945 atomic bomb. When you see the amount of energy involved, and how small the gravitational waves detected were, its easy to understand how difficult it is to observe these waves. In fact, Einstein was doubtful gravitational waves could ever be detected as they are so faint. The announcement today is a result of an effort started in the 1980’s to build the LIGO facility.
LIGO’s two gravitational wave detectors. Credit : LIGO
In 1992, the NSF granted funding for the LIGO project to commence. It consists of two facilities, one in Livingston, LA, and the other in Hanford, WA. As a sidenote, Hanford was the site of a key plutonium production plant during the Manhattan project. Each facility has two 4 km tubes where a laser is sent through. The mirrors in the interferometer are calibrated so when the two light beams reach their final destination, they cancel each other out so no light is recorded at the photodetector. This is known as destructive interference and is pictured below.
Credit: NASA
If a gravity wave passes through LIGO, the ripple in space-time moves the mirrors just enough to cause the laser to captured by the photodetector. This movement is much too slight to be felt by humans and thus the need for sophisticated equipment to catch it.
Credit: LIGO
LIGO has been operational since 2002. During its first run, no gravitational waves were detected. LIGO underwent a recent $220 million overhaul to increase its sensitivity. As mentioned in the press conference today, LIGO is only at a third of its final expected resolution capability. This bodes very well for more discoveries at LIGO over the next decade. In all, LIGO has cost $650 million since its inception in 1992. That is 1/10th the cost to rebuild the San Francisco-Oakland Bay Bridge. This discovery has the potential to open a new window of observation for astronomers.
To the general public, astronomy for the most part means the classic image of an astronomer peering through an optical telescope or the famous imagery from the Hubble Space Telescope. What is not as well known are telescopes that observe other forms of radiation. This includes Earth-bound radio telescopes and space telescopes such as the infrared Spitzer Space Telescope and the Chandra X-ray Observatory. Why bother with these other forms of radiation? Think of it this way, imagine a tower located a mile away on a foggy day. The tower has both a light beacon and radio transmitter. The fog blocks out the light, making it invisible. However, if you have a radio receiver, you’ll be able to pick up the radio transmission as fog is transparent to radio waves. In this manner, astronomers use different types of radiation to detect objects not visible in the optical range.
Besides the continuing upgrade at LIGO, there are future gravitational wave observatories anticipated in India, Japan, and it is hoped, in space. Today’s result overcomes the most important hurdle. When LIGO was funded, many scientists were skeptical it could actually detect gravitational waves. Now that we know it can be done, that clears a major obstacle for funding. The opening of the radio window allowed the discoveries of pulsars and the cosmic microwave background radiation. The x-ray window allowed us to view accretion disks around black holes. The next decade should provide us with additional surprises about the universe as the gravitational wave window opens up.
Credit: LIGO
Above is the LIGO gravitational wave detection result announced today. The strain is the distance space-time was stretched during the event. At 10-21 m this is, as mentioned before, about 1/1000th the size of an atomic nucleus. What gives the LIGO team confidence this is not a false detection as the one produced by the BICEP team two years ago is the gravitational wave was detected by both the Livingston and Hanford observatories. You’ll also note how closely the observed wave matches with the predicted wave. The hallmark of progress in science is when theoretical prediction matches observation. If Einstein were around to see this, I suspect he may have had heart palpitations just as when he found a match between relativity and the orbit of Mercury 100 years ago.
*Image on top of post displays how the colliding black holes produced the gravitational waves discovered by LIGO. Credit: Credit: LIGO, NSF, Aurore Simonnet (Sonoma State U.)
Centuries ago, Polynesian explorers settled on dozens of Pacific islands spanning from New Guinea to Hawaii to Easter Island. Living on several islands provided the Polynesian culture a better chance for survival. If disaster struck one island, the culture could still thrive on the other islands. This is often, as recently expressed by Stephen Hawking, used as a rationalization for space colonization. Is this a realistic model for human survival? The best way to answer that is to understand how Earth protects life, what could endanger life on Earth, and how difficult it would be to migrate into space.
The Sun resides in a relatively quiet area of the galaxy referred to as the Local Bubble. This bubble was created by a series of nearby supernovae events some 10-20 million years ago. Even so, the Solar System is bathed with galactic cosmic rays and ionized solar winds which are harmful to life. The Earth offers protective layers that insulates life from the harsh realities of space. The magnetic field guides ionized particles towards the polar regions. The harmful kinetic energies of these particles are absorbed by oxygen and nitrogen atoms in the upper atmosphere and converted to harmless light radiation in the form of the aurora. The ozone layer blocks harmful ultraviolet (UV) rays from reaching the surface. In fact, the upper atmosphere heats up at the ozone layer where the high energy UV radiation is absorbed.
Stratospheric heating (red) caused by ozone layer absorbing UV rays. Credit: ESA
The Earth’s atmosphere also absorbs high energy x-rays and gamma rays. This is a key point as our first attempt to colonize space will most likely be on Mars. And Mars does not offer the protective layers that Earth does from the harmful radiation of space. Any attempt to colonize the red planet will need to invent technologies to provide protection from space radiation. Also, Mars has only 1/3 the gravity of Earth which can deteriorate body muscle throughout a long duration stay. We cannot change Mars’ gravity and for this reason, some propose to make future Mars missions a one way colonization effort* as returning to Earth’s gravity may be problematic.
How feasible is it to colonize Mars? To put it in perspective, it is much easier to colonize Antarctica. Currently, there are a few dozen scientists who occupy the South Pole station in any given year. Going to Mars is possible, but during the next few decades only a handful, at best, will occupy our nearest neighbor. When evaluating possible disaster scenarios on Earth, what type of timeline are we looking at?
For now, I want to focus on natural, rather than human induced, disasters. First on deck are supervolcanoes. A supervolcano is an eruption that releases at least 500 cubic km of magma. By comparison, this is 500 times larger than the Mt. St. Helen’s eruption in 1980. These events are pretty rare, about once every 100,000 years. To put that in perspective, the Pyramids of Ancient Egypt were built 5,000 years ago. The last supervolcano eruption was Lake Toba 74,000 years ago in Indonesia. These events can lower global temperatures 10 degrees Celsius over a period of ten years. Once believed to have reduced the human population to 11,000, new evidence suggests that Lake Toba was not as catastrophic to humanity as originally thought.
While that is good news, a supervolcano would certainly be disruptive to human civilization. And while the chances are such an eruption in the near future are remote, at some point in time there will be one. One such mantle hotspot resides in Yellowstone. Recently, the Yellowstone magma chamber was mapped.
Credit: Hsin-Hua Huang, University of Utah.
The newly found lower chamber contains about 11,000 cubic km of magma. The last Yellowstone eruption occurred 640,000 years. The chances of an eruption in the near future is very slim. As destructive as these events can be, it appears that the next such event could be 10,000 or more years in the future. At this point, there seems little that could be done to thwart the threat of a supervolcano. That is not the case with the danger of an asteroid/comet strike.
Impact events are not uncommon. Small meteors collide with Earth everyday, usually burning up in the atmosphere. When they are large enough to survive the frictional forces of the atmosphere, they strike the ground and are then called meteorites. These objects are collector items but also valuable for scientific research. Unlike the Moon, erosion typically wipes away evidence of past large impact events. One exception is in Arizona where the dry climate has kept intact a 1,300 meter wide crater for 50,000 years from a 30-meter meteor impact event.
Arizona Meteor Crater and Visitor Center. Credit: Shane Torgerson/Wiki Commons
If a impact is large enough, sizable amounts of material can be ejected into the atmosphere causing global cooling and potential danger to life. Most famously, an impact near the Yucatan Peninsula 65.5 million years ago killed off the dinosaurs. This was one of the largest impacts in the inner Solar System since the heavy bombardment formation stage some four billion years ago. The cause of this was an object 10 km wide. How often does such an event take place?
Fortunately, extinction type impacts are very rare. In fact, the impact causing the dinosaur extinction is the last known event of this magnitude. More common are smaller, but still damaging impacts such as the 1908 Tunguska event in Siberia. In this case, a 120 foot object vaporized some 5 miles above the ground and the concussion was felt dozens of miles away. While potentially devastating on a local scale, these impacts would not present a threat to humanity on a global basis. Impacts of this scale occur around once every 300 years.
Trees knocked over by Tunguska impact. Credit: Leonid Kulik
Unlike supervolcanoes, it is feasible to mount a defense against a possible asteroid or comet impact. NASA now has Planetary Defense Coordination Office whose mission is to locate, track, and devise efforts to defend against collisions with Near Earth Objects (NEO). NASA has discovered over 13,000 NEO’s and detects an additional 1,500 NEO’s per year. The program’s budget is $50 million annually. That is 25% the cost to make the most recent Star Wars movie. NASA’s goal is to have a test mission to redirect an asteroid during the 2020’s. While we can plan to defend against impact events, the stellar evolution of the Sun is much more problematic.
The Sun is an average sized main sequence star halfway through its expected lifespan of 10 billion years. Main sequence stars like the Sun fuse hydrogen into helium in their cores. Over the next billion years, the Sun will become hotter and more luminous. As a star ages, the rate of fusion in its core rises. Some 3.5 billion years from now, the Sun will emit enough energy to vaporize the oceans and propel Earth’s remaining water vapor into space. And it doesn’t stop there. About 5 billion years from now, the Sun’s core will run out of hydrogen and begin fusing helium into carbon. The core will become hotter causing the Sun to expand into a red giant. At this point, the Sun will consume the inner planets including Earth. Here, humankind will need to develop interstellar travel or cease to exist.
Would interstellar travel guarantee our survival as a species? Not quite. The universe itself is evolving and has a life span. Currently, the universe is expanding at an accelerating rate. If this trend were to continue, 22 billion years from now some models predict the Big Rip will occur. In this state, all matter down to sub-atomic particles will have been shredded apart, making life in our universe impossible. Unlike stellar evolution, the eventual outcome of the universe is not completely known. While we can observe other sun-like stars to see how they live and die, we do not have the ability to observe other universes to do the same. And in fact, we do not even know what 95% of our own universe is made of. Nonetheless, physicists, such as Michio Kaku, have floated proposals for life to escape to a parallel universe when ours becomes uninhabitable.
So, how should we plan for the future of humanity and where do we place our priorities? Lets take a look at a potential timeline of possible threats.
Climate change: 0-100 years
Nuclear proliferation: 0-100 years
Supervolcanoes: 0-30,000 years
Impact: 0-tens of millions of years
Sun: 3.5 billion years
Universe: Tens of billions of years
The most imminent threats are human made, rather than natural. It is technically feasible to defend against meteor/comet strikes while not the case with supervolcanoes. More than likely, that leaves us with a few thousand years to figure out how to establish a permanent human presence on Mars. Certainly, going to Mars is doable if the incentive is there to devote resources and funding. It will not be possible to defend Earth against the Sun’s stellar evolution. If interstellar travel is possible, and that’s a big if, we have on the order of a billion years to find a way to do that. Like a lot of space enthusiasts, I’d like to see that happen in the 23rd century just as in Star Trek. However, unlike exploring the Solar System, the distances involved with interstellar travel will require a far-reaching advancement of physics and engineering that is not guaranteed to happen. So what do we do now?
Hollywood blockbusters notwithstanding, the major priority should be getting a handle on human induced dangers such as climate change and nuclear proliferation. Concurrently, we can continue our efforts to begin human exploration of Mars. All this can take place in the next century but it must be stressed a human settlement on Mars is not a substitute for cleaning up our act on our home planet. During this time, we will begin to discover Earth-like planets, and possibly, life beyond our Solar System.
Efforts to begin interstellar exploration are in a very, very prototype stage. Relativity places a limit on velocity at the speed of light. Concepts to bypass this limit are speculative at best and are why, as mentioned earlier, will require a deeper understanding of physics to accomplish. This advancement will have to be on the order of what Issac Newton achieved in the late 1600’s and modern (both Einstein and the quantum physicists) physics in the 20th century. When and if this happens, we can plan for humanity’s migration to the stars to escape the Sun’s vaporization of Earth. If we are fortunate enough to accomplish that, we can owe it to the same spirit that carried the Polynesians in their wooden canoes across the vast expanse of the Pacific.
*To be clear on this point, the Mars One initiative is not realistic in its timeline or funding. However, other proposals, such as offered by Buzz Aldrin, may be more realistic.
**Image on top of post is the famous Earthrise photograph from Apollo 8, the first space mission to carry humans to another celestial object. Taken on Christmas Eve, 1968. Credit: NASA.
During the 1930’s, Mt. Wilson Observatory was famous for the revolutionary work of Edwin Hubble. Galaxies were discovered to exist outside the Milky Way and the universe was found to be expanding. In 1931, Einstein would visit the observatory and at Caltech, listen to a seminar by Fr. Georges Lemaitre on the theory of the origins of the universe, later dubbed the Big Bang. The founder of observatory, George Ellery Hale, was busy working on the successor to the 100-inch Mt. Wilson telescope. In 1934, the 200-inch mirror was cast, with a great amount of public fanfare for the future observatory at Mt. Palomar. Meanwhile, at the same facility, under the radar of the media, Fritz Zwicky was unearthing one of the great mysteries of astronomy today.
Fritz Zwicky. Credit: California Institute of Technology.
The Coma Cluster consists of some 1,000 galaxies at a distance of 320 million light years from Earth. The cluster itself is about 20 million light years wide. In 1933, Zwicky published a study of the cluster which indicated its mass was much greater than its visible content could account for. Had the optical mass of the cluster was all that existed, the velocities of the galaxies would have exceeded the escape velocity of the cluster, meaning there would not have been a cluster at all. Zwicky realized there must have been mass in the cluster that could not be seen. It was this extra mass that increased the escape velocity of the cluster keeping it intact. The results were originally published in a Swiss journal Helvetica Physica Atca (Zwicky was originally from Switzerland). Zwicky dubbed the invisible mass dunkle materie, or dark matter.
The Coma Cluster. Credit: NASA, ESA, and the Hubble Heritage Team (STScI/AURA). Acknowledgment: D. Carter (Liverpool John Moores University) and the Coma HST ACS Treasury Team.
It would take a few decades for the concept of dark matter to gain traction in astronomy. Part of it was new technology needed to be developed before it could be researched further. Part of it was Zwicky was ahead of his time. Besides dark matter, Zwicky developed the groundwork for ideas such as supernovae, neutron stars, and galactic gravitational lenses. Familiar to astronomers today, these were radically advanced concepts during the 1930’s. Zwicky also had, even by the standards of academia, a contentious personality towards other astronomers. Most famously, Zwicky referred to his fellow astronomers as “spherical bastards”. Why? They were, according to Zwicky, bastards any way you looked at them. Needless to say, this did not endear Zwicky to other astronomers, who were reluctant to promote Zwicky’s ideas.
Those issues aside, one by one, Zwicky’s theories received observational confirmation. Zwicky would discover 120 supernovae, the most by any astronomer. The first neutron star was discovered in 1967 with the radio detection of a pulsar in the Crab Nebula. The first image of gravitational lensing of a quasar occurred in 1979. As for dark matter, it would take the efforts of Vera Rubin, who faced bias against her work, to provide verification of its existence.
Vera Rubin in 1967, when she became the first women allowed to observe at Mt. Palomar. To the right is Konrad Rudnicki. Credit: Carnegie Institution for Science.
Unlike Zwicky, Vera Rubin did not give cause for astronomers to disdain her work. Astronomy has been traditionally a male dominated field. Many top graduate astronomy departments did not admit women until the 1970’s, and it was Vera Rubin who became the first women to observe at Mt. Palomar in 1967, nearly two decades after it had seen first light. The overall bias against women caused astronomers to greet Rubin’s early work with skepticism, and in some cases, downright hostility. In the end, the high quality of Rubin’s work would break through these barriers.
During the 1970’s, Rubin and her colleague Kent Ford, embarked on a study of galactic rotation curves. Kent Ford was responsible for building spectrographs sensitive enough to detect the Doppler shifts of stars as they orbited around a galactic core. Rubin decided upon this program for among other things, it would not require as much telescope time to complete as she had to balance her career with her family life. The expected result was that the farther out a star was from the center of mass in a galaxy, the slower its velocity would be. When it came time to bump the data against the model, the results came out like this.
Credit: Queens University.
This mirrored Zwicky’s study of the Coma cluster four decades earlier. If the optical mass was all there was to the galaxy, the stars at the outer edge were going so fast they would escape the gravity of the galaxy. However, that was not the case and there was much more dark matter holding these galaxies together than luminous matter. In fact, Rubin’s measurements indicated that only 10% of galactic mass was of the visible variety, and 90% was dark matter. Thus, 90% of galaxies were made of stuff that astronomers had no idea what it was. This was a staggering revelation.
When a discovery such as this that runs so counter-intuitive to the expected result, it will typically come under very critical review. That’s a good thing and a necessary part of the scientific process as long as it is the data being scrutinized and it does not become a personal matter. The best way to rebut criticism of a discovery is to provide replication. In 1970, Rubin and Ford published the flat galactic rotation curve for the Andromeda Galaxy. Throughout the decade, astronomers sought out a solution for the rotational curve without dark matter. However, by 1978, dozens of rotational curves reproduced the original result and hundreds more would follow the next decade. The dam had broke and by the time I was an undergrad student in the early 1980’s, dark matter had become standard material in galactic astronomy courses.
I distinctly remember the shock of learning 90% of the universe was made of dark matter whose nature was not known, but whose gravitational effects were clearly observed. In 1998, astronomy was rocked again by the discovery that matter, both luminous and dark, itself comprised only 20-25% of the universe. And this discovery would again trace its roots to Fritz Zwicky.
In 1937, Zwicky discovered a supernova that was distinctly different from what he had observed before. This supernova was brighter, and faded at a slower rate. Unlike the other supernovae, this was not the death throes of a high mass star. This was an explosion of a white dwarf that was siphoning mass from a companion star. Six years earlier, Subrahmanyan Chandrasekhar determined the maximum mass a white dwarf can obtain is 1.4 Suns. Once a white dwarf tops this amount of mass, its dense (a teaspoon of a white dwarf weighs 15 tons) carbon rich core ignites and creates a supernova. Since white dwarfs are the same mass when they explode, the brightness of these events are roughly identical. This gives astronomers a “standard candle” to calibrate distance. These events were eventually referred to as a Type 1a supernova.
Subrahmanyan Chandrasekhar won the Nobel in 1983 for his work on stellar interiors. The Chandra X-Ray Observatory was named in his honor. Credit: University of Chicago.
During the late 1990’s, two teams of astronomers were competing to measure how gravity slowed the expansion of the universe since the Big Bang. The expectation was over time, gravity would rein in the rate of expansion. The way to determine this is to measure the red shift of Type 1a supernovae. As an object races away from Earth, its spectrum is shifted towards the red. The faster it is moving away, the greater the red shift. As these supernovae serve as a standard candle, their distance could be determined. The farther away these events were, the older they occurred as it would take longer for their light to reach Earth. Thus, the goal was to utilize Type 1a supernovae to measure the expansion of the universe throughout its history.
In 1998, the High-Z Supernova Search Team and the Supernova Cosmology Project independently released their results. What they found was not only did gravity fail to slow the expansion of the universe, but the expansion was accelerating. Gravity, obviously, was still around, but there was a mysterious force in the universe that not only counteracted gravity, but was of increasing presence as the universe expands. This force was referred to as dark energy and makes up some 70% of the universe.
What was discovered as well is the universe, like stars and galaxies, has evolved over time. Up to 5 billion years ago, gravity did slow down the expansion of the universe. After that epoch, dark energy became a stronger force and the expansion began to speed up. To put that time into perspective, the Earth and the Solar System is 4.5 billion years old. The timeline of the expansion is shown below.
Credit: NASA/ESA and A. Feild (STScI).
As the expansion accelerates, some hypothesize that the universe will end in what is called the Big Rip. This refers to a state where the universe expands to the point where stars, planets, and even atomic particles are shredded apart. To be sure, life could not exist in such a universe. However, there is no need to worry, the latest estimate is a Big Rip would take place 22 billion years from now. And at any rate, we’ll need to learn more about what exactly dark energy is before we arrive at a definitive theory on the ultimate fate of the universe.
Currently, the South Pole Telescope is dedicated to researching dark energy. Built by the University of Chicago, the 10-meter telescope is dedicated to locating galaxy clusters for the purpose of mapping cluster formation throughout the life of the universe. It is hoped this effort will provide further answers on how both gravity and dark energy has shaped the expansion of the universe. The future of dark energy research remains in the Southern Hemisphere but in Chile.
The Vera Rubin Observatory is currently under construction in Northern Chile and is expected to be operational by 2024. The cost of the Rubin Observatory is estimated at $465 million, about half the cost of a new NFL stadium. Funded by a combination of public and private sources, this 8.4 meter wide angle telescope is designed to have the ability to survey the entire sky in three nights. The wide field of view will enable the Rubin Observatory to map large scale galactic structures and survey Type 1a supernovae over a ten year period. This will provide a more comprehensive map of how dark energy and dark matter have influenced the overall structure of the universe throughout time.
Rubin Observatory under construction with Milky Way overhead. Credit: Bruno C. Quint/Rubin Observatory CC 4.0.
Given the dramatic nature of the discovery of dark energy, dark matter has been a bit overlooked since 1998. However, there have been some key advancements in the study of dark matter during that time. The Hubble Space Telescope was able to map dark matter by measuring gravitational lensing. Gravity bends light rays and as a result, distorts galactic images. While dark matter cannot be seen its gravitational effects can be observed. What was found is that dark matter had a smoother distribution during the early universe but is more clumpy now. This clumpiness creates a scaffolding for which galactic clusters form upon.
In 2015, dark matter was detected interacting with itself. In a galactic collision in the cluster Abell 3827, dark matter was detected to lag behind normal matter. This could provide a key clue as to what dark matter is as previously it was only detected to interact gravitationally. If “dark forces” among dark matter exist causing this interaction, then this discovery may help physicists model dark matter in a more complex and accurate manner. Ideally, this will help determine what exactly dark matter is.
So where does our knowledge of the universe stand now? The recent ESA Planck mission mapped out the cosmic microwave background (CMB). The CMB is the remnant of the Big Bang and shows us the state of the universe when it was 380,000 years old. By measuring the fluctuations in the CMB, astronomers were able to breakdown the universe as follows:
Dark Energy: 68.3%
Dark Matter: 26.8%
Ordinary Matter: 4.9%
So the matter we see around us, the Earth, Sun, stars and galaxies, only comprise slightly less than five percent of the universe. The remaining 95% is made of stuff that is unknown to us. That, along with the question of life beyond Earth, represents the most important mystery for astronomers to solve in the upcoming decade.
*Image on top of post is the galactic cluster Abell 2218. Where there is a galactic cluster, there is dark matter. The gravity of both ordinary and dark matter deflects light just like a lens does. The result is galaxies behind the cluster are magnified and distorted. The magnification effect allows astronomers to image galaxies far away behind the cluster that ordinarily would not visible. Credits:NASA, Andrew Fruchter and the ERO Team [Sylvia Baggett (STScI), Richard Hook (ST-ECF), Zoltan Levay (STScI)] (STScI).
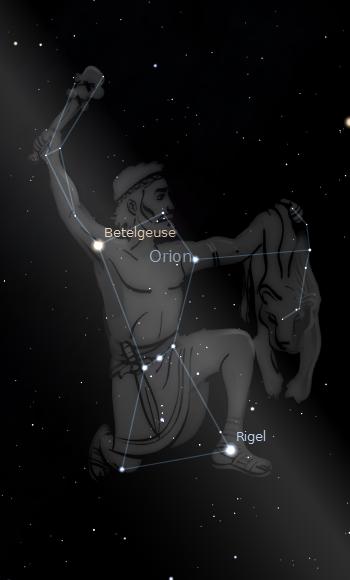
With origins dating back to Homer’s epic Odyssey and one of the 48 constellations listed in Ptolemy’s Almagest, Orion provides a link for astronomy’s transformation between mythology and science. Many of the stars in Orion bear names rooted in Arabic, artifacts of the golden age of Islamic astronomy from 800 – 1450 A.D. Presently, NASA has designated Orion as the title for its deep space vehicle to carry humans to destinations beyond the Moon. As the winter solstice approaches, the most famous constellation begins to make its appearance high in the evening sky. Orion contains a rich tapestry of stars, nebulae, and history.
Credit: IAU and Sky & Telescope.
In early December, Orion rises above the eastern horizon around 7 PM. As the winter progresses, Orion rises earlier and earlier, meaning its zenith in the sky falls in the early evening hours making its visibility very prominent to anyone out and about at night. Located on the celestial equator, adjacent to the zodiacal constellations Gemini and Taurus, Orion is observable in both the Northern and Southern Hemispheres. The main seven stars are red or blue giants and are very luminous. To put the brightness of these stars in perspective, lets compare them to the Sun using a Hertzsprung-Russell (H-R) diagram.
Luminosity is in solar units (Sun = 1). Temperature is in Kelvins.
The Sun is represented by the yellow dot. You will note one of the quirks in the H-R diagram is that temperature, depicted by the horizontal axis, is scaled in reverse. That means hotter stars are on the left and cooler stars are on the right. All of the major seven stars of Orion are 10,000 to 100,000 times brighter than the Sun. In fact, most of the stars you see when looking at the night sky without the aid of a telescope will be brighter than the Sun. In the case of Orion, the stars are blue-white giants with the exception of Betelgeuse which is represented by the dot to the far right of the diagram. Betelgeuse is cooler than the Sun, how could it be so much brighter? The answer lies in its size.
Betelgeuse is so large the orbit of Mars could fit inside of it. A 100-watt light bulb is brighter than a 60-watt light bulb. However, ten 60-watt light bulbs are brighter than a single 100-watt light bulb. That is why Betelgeuse, despite being a relatively cool 3,500 K, is so luminous. Betelgeuse is a red giant, which means it is in the latter part of its life. A star becomes a red giant when all the hydrogen in its core has been burned up. As a star begins to fuse helium, the core becomes hotter, expanding the star much like hot air expands a balloon. Eventually, Betelgeuse will go supernova. Will we see this event? It’s possible, but not probable. A recent estimate predicts the supernova to occur in 100,000 years. To put that in perspective, the pyramids of Ancient Egypt were built about 5,000 years ago. But that’s not to say Betelgeuse is not interesting to observe now.
Looking at Orion, Betelgeuse occupies the upper left corner. Most stars appear to be white to the naked eye. With Betelgeuse, one can detect its red color. Most stars are too dim to activate the cones in our eyes that can discern color. Betelgeuse provides the opportunity to see the true color of a star without a telescope and/or camera. With a telescope, Betelgeuse provided astronomers the opportunity to make it the first star whose disk was resolved beyond a point of light. In 1996, the Hubble Space Telescope imaged the surface of Betelgeuse.
Betelgeuse, 1996. First image to resolve a stellar surface besides the Sun. Credit: Andrea Dupree (Harvard-Smithsonian CfA), Ronald Gilliland (STScI), NASA and ESA
Betelgeuse has attracted the curiosity of astronomers for centuries, and the roots of its distinct name is a legacy of that history. The word Betelgeuse is derived from the Arabic word Yad al-Jawza, which means forefront of the white-belted sheep. Many star names have their origins from the golden era of Islamic astronomy. One tip off of a word with Arabic origins is if it begins with “al”, which is equivalent to “the” in English. In Orion, the stars Alnitak (the girdle) and Alnilam (the belt of pearls) are two such examples. The Orion stars Mintaka (belt), Saiph (sword of the giant), and Rigel (rijl – foot) are also Arabic in nature. Of the seven major stars of Orion, Bellatrix is the outlier as it is derived from the Latin word for female warrior.
Scholars at the Abbasid Library in Baghdad, 1237. Many prominent astronomers from Central Asia traveled to Baghdad’s House of Wisdom to study. This library was sacked during the Mongol invasion of 1258. Credit: Wiki Commons.
The Arabic influence extends into math (algebra) and computer science (algorithm). As S. Frederick Starr describes in his book, Lost Enlightenment, the epicenter of this scientific golden age was in a region of Central Asia spanning from Eastern Iran to Western China and Kazakhstan to Northern Pakistan and India. As the Islamic Empire grew during this period, Arabic became the de facto language of science much as English is today. The Islamic astronomers were among the first to begin the process of challenging Ptolemy’s Earth centric model of the universe.
Ptolemy had listed Orion as a constellation in his Almagest. Note this title begins with the letters al. As you may have surmised, this is the Arabic translation of the title which is The Greatest Compilation and translates into Arabic as al-majisti. Ptolemy wrote Almagest in 150 A.D., and it survived as the primary star catalog until 1598 when Tycho Brahe published his thousand star catalogStellarum octavi orbis inerrantium accurata restitutio. While Ptolemy was known to dabble in astrology, Almagest was concerned with the mathematical modeling of the motions of celestial objects. The mythology of Orion predates Ptolemy by several centuries.
Credit: Wiki Commons
While it can be difficult to discern mythological patterns in most constellations, it is easy to see how the Ancient Greeks viewed Orion as a hunter. In Greek mythology, Orion’s father was Poseidon. During the early 1970’s, a movie called The Poseidon Adventure, featuring an ocean liner capsized by a tidal wave, kickstarted a decade of disaster movies. The mythological Poseidon could walk on water and Orion inherited that trait. Orion, of course, was also a great hunter. So great, in fact, he threatened to kill every animal on Earth. This caused Orion to run afoul of Gaia, the goddess of Earth, who sent a scorpion to kill Orion. Both the scorpion and Orion were placed by Zeus in the heavens. Scorpius is most prominent in the summer sky while Orion is most prominent in the winter sky. The scorpion is always chasing the hunter in the heavens.
Death and rebirth is often a theme in mythology. That is also the case in the universe. Orion the constellation is home to the Orion Nebula, at 1,340 light years away, the closest stellar nursery to Earth and home to some 1,000 newly born stars. The Orion Nebula (aka M42) is located in Orion’s sword and can be seen with the naked eye and you can take an image of it with your cellphone. When the Hubble is pointed at the Orion Nebula, it looks like this:
Credit: NASA, ESA, M. Robberto (Space Telescope Science Institute/ESA) and the Hubble Space Telescope Orion Treasury Project Team
The glowing gas of the Orion Nebula is lit up by four massive stars which constitute the Trapezium cluster. These stars, along with the 1,000 forming stars, blast through the nebula with high stellar winds creating a cauldron of bubbles, bow shocks, and pillars of dust and gas. Along with these structures are protoplanetary disks in which systems of planets such as our Solar System may originate. The Orion Nebula is an example of how gas is recycled from stars that went supernova to build new stars. The heavy elements (elements besides hydrogen and helium) that make up the Earth and our bodies were assembled in the fusion reactions of first generation stars, then spread out into the galaxy via supernova explosions. Our Sun is a second generation star produced from the supernova remnants of a first generation star. Thus, as Joni Mitchell would say, we are stardust.
Could life exist in the stars that comprise the constellation Orion? Science fiction writers have often used Orion and its stars in their stories as the reading audience is familiar with these names. In Star Trek, there were the infamous green Orion slave women and Rigel is mentioned in several episodes. If life does exist in Orion, it would not be in planets around the main seven stars of the constellation. Those stars are either blue or red giants. Giant stars live fast and die young as they expend prodigious amounts of energy, much like a gas guzzling automobile. The lifespans of these stars are on the order of tens of millions of years. This is much shorter than the 700 million years it took single cell organisms and 4.5 billion years for intelligent life to develop on Earth. If life exists in Orion, it would be around the dimmer, Sun-like stars that usually require binoculars or a telescope to detect. These stars burn at a slower rate, giving them a lifespan of the several billion years that could enable life to evolve on an orbiting planet.
One can look up at Orion and imagine the state of human civilization in years past. Rigel is 733 light years and Betelgeuse is 642 light years, give or take a few dozen for measurement uncertainties, from Earth. A light year is the distance light travels in, you guessed it, one year. When you look at Rigel and Betelgeuse, the light photons striking your eyes began their journey from those stars during the late 1200’s and 1300’s. In other words, you are looking at those stars as they were during the waning years of the golden age of Islamic astronomy, when those stars were named. Like all societies, the Islamic Empire faced a struggle between science and mythology as the basis for knowledge.
During Artemis I, Orion will venture thousands of miles beyond the moon during an approximately three week mission. Credit: NASA
Certainly the Ancient Greeks endured that struggle as well. Ptolemy practiced astronomy and astrology side by side. Currently, America is experiencing a distinct anti/pseudo scientific political and social movement, while at the same time NASA has named its developing deep space vehicle Orion. Often we view struggles within civilizations as ideological and/or theological conflicts. Whether a society advances scientifically depends more so on the clash between rational thought, validated by empirical evidence, and verified by independent sources against dogmatic thinking not open to critical review. History will tell you the correct path to go, and in many respects, astronomer’s attempts to understand that most prominent constellation in the sky has been side by side with that struggle.
*Image at top of post is how Orion appears in the evening sky during winter. Credit: Wiki Commons.
On Christmas Eve, 1777, the HMS Resolution landed on a small, isolated island 2,160 km south of Hawaii. The captain of the HMS Resolution, James Cook, named the island for the day it was discovered. Over a century earlier, 9,000 km across the Pacific, fishermen off the coast of present day Peru noticed a periodic warming of Pacific waters that coincided with a drop in local fish population. This event, which occurs every few years around Christmas day, was named El Nino or Christ child. Today, the coral reefs off Christmas Island (aka Kiritimati Island) are a focal point for researchers who stand ready to measure potential coral bleaching as a consequence of this year’s El Nino. This event influences weather far away from Christmas Island, and as we’ll see, across the globe.
El Nino is a natural phenomena that occurs periodically and is not a recent climate development. In fact, climatologists have studied clam fossils to measure El Nino events going back 10,000 years. El Nino is caused by an oscillation of high and low pressure zones and ocean temperature in the eastern equatorial region of the Pacific. For this reason, El Nino is formally named by scientists as the El Nino – Southern Oscillation or ENSO. While El Nino is associated with warmer ocean waters, its counterpart, La Nina (Little Girl in Spanish) is marked by colder than normal waters in the same region. To understand one, you need to understand the other. The image below shows the Pacific temperature variation between the two events.
Credit: NOAA
You’ll note that the temperature variation is not very great, just a few degrees Celsius. However, given the size of the area the temperature anomaly occurs, this can have a dramatic effect on atmospheric circulations in the region. Warm ocean waters transports heat into the atmosphere above it. Warm air rises, creating a low pressure area that tends to be unstable and results in precipitation. Cooler ocean waters stabilizes the air above it. Cold air tends to sink and this results in a region of high pressure which is marked by low participation. So, what causes this oscillation? Lets take a look at the global wind map below:
Credit: NASA/Caltech
For those of us who live in the Northern Mid-latitudes such as the United States or Europe, we are used to winds prevailing from the west. However, in the equatorial tropics, where the ENSO takes place, the trades winds prevail from the East. Typically, these easterly trade winds push the Pacific waters towards the west. Normally the result is this:
Credit: NOAA
The easterly trade winds cause warmer water to pool up in the Western Pacific by Australia. The heat from the ocean transfers to the atmosphere in the region, which in turn, causes instability in the air. As the air rises, it cools, releasing moisture in the form of rain. This pattern causes the wet season in Australia from November to March. Warm water also expands, which means sea level is higher in the Western Pacific than the Eastern Pacific. The warm water in the west sinks and becomes colder. The ocean circulation returns this cold water to the coast of South America. The upwelling of this cold water brings with it nutrients for fish to feed from. A La Nina event is an amplification of these conditions.
An El Nino event is a flip-flopping of this pattern. During El Nino, the easterly trade winds die down, causing warm water to migrate back towards the coast of Peru rather than around Australia resulting in the scenario below:
Note the differential in sea level is exaggerated. Typically there is a 0.5 meter difference in sea level between the western and eastern ends of the Pacific. Credit: NOAA
Throughout El Nino, the upwelling of colder, nutrient rich water off the Peruvian coast weakens. As their food supply drops, fish in the region migrate away. This means lower catch amounts for fishers, which was observed in the 1600’s. In the west, rain moves away from Australia bringing in drought conditions. In the east, the warmer than normal waters produce flooding on the west coast of South America. Globally, an El Nino can result in a spike in global temperatures. And here is why:
The 1998 El Nino was among the strongest on record. Credit: NOAA
During El Nino years, warm Pacific waters are dispersed over a larger surface area. Have you ever seen rain water pool up on a race track? Typically, to dry the track faster, crews come out with blowers to disperse the water over a wider area of the track, making it easier for water to evaporate into the air. El Nino essentially does the same thing. By dispersing warm water over a wider area, it allows for greater rate of transport of ocean heat into the atmosphere. The 1997-98 El Nino was the strongest on record, and that was reflected as a surge in global temperatures in 1998:
Credit: NOAA
The 1982-83 El Nino also brought about a rise in global temperatures. Thus, ENSO brings short term noise into global temperature data. Other climate factors do this as well. For example, powerful volcanic eruptions can eject sulfur dioxide into the stratosphere. This results in global cooling for a period of 2-3 years. You can see that above as the Mt. Pinatubo eruption in 1991 caused a brief drop in temperatures in the early 1990’s. To discern between short term and long term effects, trend lines are used which are in blue above.
Note that, contrary to what you may hear in some quarters, global temperatures have continued to trend upwards since 1998. Trend lines are typically regression calculations which minimize sums of the distances between the individual data points and the trend line. Some charts have trend lines starting at the 1998 point and ending at a later data point lower to “prove” temperatures have not risen since 1998.
That is a statistical no-no!
Doing so would flunk you out of introductory statistics as that would not meet the regression fit requirements. This is not the only area where the popular media confuses short term and long term trends. You see it when economic data such as the monthly job report comes out. Not only do monthly figures contain a lot of short term noise, but they are typically revised later. Stock and commodity prices are also pretty noisy and often media reports hyperventilate over insignificant daily trends. Students have complained to me that statistics is boring, but it can be one of the most useful, practical courses one can take.
Moving off my soap box and back to El Nino, what else can we expect to encounter during an El Nino year? The oscillation of high and low pressure zones in the Pacific can have a dramatic effect on the jet stream and weather tracks across the Americas.
Credit: NOAA
During the La Nina phase, high pressure in the North Pacific deflects the jet stream into Alaska where it sweeps down across Canada into the Northern United States bringing polar air along with it. During El Nino, low pressure in the Pacific allows the jet stream to drop southward. The heat from El Nino strengthens the jet stream. This creates a strong storm track that can bring significant rainfall and flooding across California and the South. Polar air can be trapped north of the U.S. resulting in warm winters in the Midwest and Northeast. The 1982 El Nino brought in the warmest Christmas in Buffalo history, clocking in at 64 degrees. The 1997 El Nino brought in a year’s worth of rain, some 13 inches, to Los Angeles in February of 1998. Early detection of El Nino can help in preparations for flooding in areas such as Southern California.
In South America, closer to El Nino itself, the effects are amplified. During the 1997-98 El Nino, some areas in Peru received ten times the normal rainfall amounts. As a consequence, landslides claimed the lives of over 200 persons in both Peru and Ecuador. On the other side of the Pacific, El Nino brings abnormally dry conditions. During the same 1997-98 El Nino, drought conditions combined with slash and burn agriculture sparked wildfires in Indonesia that consumed 7 million hectares (17.3 million acres). In 2015, wildfires in Indonesia have again heralded the onset of El Nino. These fires are rich in carbon dioxide emissions and it has been estimated that so far, as much carbon dioxide has been released in Indonesia as an entire year in Japan.
ENSO oscillates between El Nino and La Nina phases. The strength of the 1982, 1997, and 2015 El Nino events are quite noticeable in this graph. Also note the phase has listed towards El Nino since 1980. Credit: NOAA
How does the 2015 El Nino compare with the great El Nino of 1997? The early returns are that this is a comparable event. In fact, the 2015 El Nino has already eclipsed the one week record set in 1997 for Pacific warming. Climatologists use a three month baseline to determine El Nino strength and if 2015 does not match 1997 on that baseline, it will not lag very far behind. That being the case, we can expect a general rerun of the events of 1997-98. As the video below explains, there are always variations to each El Nino event, but we can make probabilistic predictions to what this winter holds.
Lying in the cross-hairs of El Nino are the coral reefs off of Christmas Island. The surge in water temperature can generate a bleaching of the coral reefs. During the 1997-98 El Nino, some 20% of the world’s coral population was lost to bleaching. Warm water causes corals to eject algae called zooxanthellae. This algae lives with the coral and produces nutrients for the coral to consume. The loss of these nutrients triggers the bleaching of the vibrant colors the corals are famous for.
Example of coral bleaching. Credit: NOAA
As the Pacific waters have reached 31 C (88 F), scientists stand ready not only to record the effects of this year’s El Nino, but to utilize coral fossils to reconstruct El Nino’s history and project the future. While the bleaching of corals has historically occurred on a periodic basis, the corals typically have been able to recover. However, with the oceans temperatures trending upward as a result of global warming, this may inhibit future recoveries of coral bleaching events. El Nino is part of a naturally occurring cycle, nonetheless, it will provide us with important information on what to expect as we experience a long term, non-cyclical warming globe.
As we proceed into 2016, the El Nino will diminish and the ENSO cycle will eventually trend back towards La Nina. Global temperatures, just as happened after the 1997-98 El Nino concluded, may subside a bit. It will be important not to be fooled by the short term noise. That drop in temperature will not represent a long term shift, but only a return to the trend line. Afterwards, we should expect global temperatures to commence its rise again. Heat is energy, and as the global base temperature continues its climb, El Nino events in the future can be anticipated to be more powerful. And we will need to incorporate that, along with a lot of other implications of climate change, into our long term policy planning.
*Image on top of post is comparison of sea height anomalies between the 1997 and 2015 El Nino events. As water warms, it expands, causing sea levels to rise. Credit: NASA.
Above is the Halloween radio adaptation of the War of the Worlds by WKBW in Buffalo. WKBW originally broadcasted War of the Worlds in 1968 and updated versions throughout the 1970’s. For myself, it was a Halloween tradition to sit on the front steps, chow down some Halloween candy, and listen to the broadcast. Although the program would start at 11 PM, I had no worries, as going to a Catholic school, the following morning was All Saints Day and that meant an off day. It wasn’t only Western New Yorkers who listened to the dramatization of their city being destroyed by Martians, WKBW’s 50,000 watt transmitter would reach as far into the Carolinas once the Sun set.
The 1968 broadcast was an homage to Orson Wells legendary 1938 radio version. The events were transplanted to the Buffalo region. In 1968, KB DJ Danny Neaverth opens up the proceedings with a brief introduction. If you lived in Buffalo during that era, Neaverth’s presence around town seemed ubiquitous. I can remember watching Neaverth’s noon weather report on WKBW-TV, hearing him at an evening’s Braves game handling the PA duties (two for McAdoo!), then being woken up by Neaverth’s morning show at 6 AM so I could deliver the Courier-Express.
The 1971 version has an updated introduction by Jeff Kaye. That intro describes various events caused by the 1968 program. Much like the myth of the 1938 panic, there is some hyperbole involved. The local newspapers did not report anything unusual the following day except for a few calls made into the station. After the intro, the broadcast commences with the real newscast from that day. The first sign of something different is when the news ends with a report from Mt. Palomar Observatory that nuclear sized explosions had been observed on Mars.
The real director of the Mt. Palomar Observatory at the time was Horace Babcock (the broadcast used the name Benjamin Spencer). In 1953, Babcock first proposed the use of adaptive optics to reduce atmospheric interference for astronomical imaging. This technique, which utilizes a laser created guide star and deformable mirrors in a telescope’s instrument package, is standard on all modern observatories. From 1947-93, Mt. Palomar was the largest telescope in the world.
The 200-inch Hale Telescope at Mt. Palomar. Photo: Gregory Pijanowski.
Were the nuclear sized explosions on Mars a realistic plot point? At first glance that might not seem to be the case. However, keep in mind the Martians made it to Earth in a 24-48 hour period. Standard chemical rockets take about 8-10 months to complete a voyage to Mars. What could have propelled the Martians so fast to Earth? One possibility is nuclear pulse propulsion. The concept is targeted nuclear explosions are used to provide impulse to spacecraft. From 1958-63, Project Orion worked on such a propulsion method. Eventually, the project was shut down by the Nuclear Test Ban Treaty which, obviously, would not apply to invading Martians.
To be fair, the folks at WKBW were concerned with providing programming that had a Halloween ambiance rather than scientific rigor. And they accomplished this by letting the invasion gradually slide into the program. It is 20 minutes in until the invasion occupies the show completely. During that first 20 minutes, listeners are treated to a time capsule of 1968 radio. The news of the day opens with the Vietnam War and ongoing peace talks (the 1971 version also would open with news from Vietnam, which gives you an idea how well those talks went), Governor Rockefellar breaking ground on the new UB Amherst campus, and various local police busts. The video removed the music interludes for copyright purposes. Ads include an 8-track stereo player for $49.95 ($345 today) and shoes for $13.00 ($90 today). The broadcast takes a dramatic turn with the announcement of a meteor strike on Grand Island.
When that announcement was made, it could be heard throughout the East Coast. WKBW transmitted with a 50,000 watt tower, the maximum allowed for AM stations. At night, the range of AM stations expand greatly. I can remember listening to Sabre-Bruins hockey games and switching back and forth between the Buffalo and Boston broadcasts. Also, I have tuned into St. Louis’ KMOX in both Buffalo and Houston during the late 70’s when Bob Costas worked there. While FM has advantages in sound quality over AM, it cannot match the range of AM radio. And that is due to the nature of the Earth’s ionosphere.
Credit: NASA
During the day, ultraviolet and x-ray radiation strike atoms in the upper atmosphere. This energy ejects electrons, which carry a negative electric charge and forms the various ionosphere layers. During the day, the lower D and E layers absorb AM radio waves. Here, the atmosphere is still thick enough so electrons that absorb radio waves collide into air molecules dampening the radio signal. At night, these lower layers dissipate as there is no sunlight to continue the ionization process. This leaves radio waves free to reflect off the higher F ionosphere layer. Here, the atmosphere is tenuous enough so collisions with air molecules are rare. As a result, AM radio waves are reflected back to the ground enhancing the station’s range. FM stations do not enjoy this effect as their transmissions are at shorter wavelengths, reducing the collision rate with free ions in the F layer.
For those who heard the original broadcast outside of the Buffalo area, and those listening to it now, here is a map to give you a framework of the events:
Nominally a sleepy rural area outside of Buffalo, Grand Island has had an interesting history. Navy Island, adjacent to NW Grand Island, was once considered a potential site for the United Nations. In 1825, a city on the island called Ararat was proposed as a site for Jewish refugees which never came to fruition. The Niagara River current, as mentioned in the broadcast, is swift at 3 feet per second and would pull anyone trying to swim across away and over the Falls eventually. That, of course, happens when the Grand Island bridges are blown in a vain attempt to trap the Martians on the island.
Grand Island Bridges. Credit: amandabanana87 https://flic.kr/p/6PVNVR
The invading Martians make their way downtown to Niagara Square where Irv Weinstein is stationed atop City Hall. Weinstein started on the radio side of WKBW in the late 50’s, moving over to television in the mid 60’s. For the next next three decades, Weinstein was the most prominent news figure in the Buffalo area. Weinstein did refrain from using his trademark “pistol packing punks” (heat ray packing punks?) in the War of the Worlds. I do not know if there was actually a communications center on top of City Hall back then, but there is an observation platform. You can see Niagara Falls from up there, and on the clearest of clear days, the CN Tower in Toronto.
On top of City Hall. Credit: Gregory Pijanowski
The dramatization concludes where it began, at the WKBW radio station which was at 1430 Main St. a block north of Utica St. The voice of the last surviving news reporter belongs to Jeff Kaye. You may find that voice familiar. During the 1980’s, Jeff Kaye did an admirable job filling the large shoes of John Facenda at NFL Films. Kaye also produced the War of the Worlds broadcast. After the Martian’s poison gas takes out the last of the WKBW team, Dan Neaverth returns to conclude the broadcast noting that H.G. Wells ended the War of the Worlds with the Martians dying off, unable to resist Earth’s microbes. Wrote Wells:
“But there are no bacteria in Mars, and directly these invaders arrived, directly they drank and fed, our microscopic allies began to work their overthrow. Already when I watched them (the Martians) they were irrevocably doomed, dying and rotting even as they went to and fro.”
And more than likely, Wells was right about the lack of microbes on Mars, at least on the surface anyway. Unlike Earth, Mars does not have an ozone layer to block out ultraviolet radiation from the Sun. Also, Mars lacks a magnetic field. The Earth’s magnetic field shields life from harmful cosmic rays Unabated, this radiation is highly harmful to any life on the Martian surface, whether it be microbes or astronauts in the future. However, the subsurface of Mars may be another story.
One of the key discoveries on Mars the past few decades has been the existence of water below the surface. On the surface, the lack of atmospheric pressure reduces the boiling point of water so that if it does not freeze it will evaporate quickly. However, the subsurface of Mars has been found to have significant amounts of water. Planning for future human exploration of Mars entails utilizing this water for long duration stays on the red planet. Moreover, where there is water, there may be life. And this leads to the issue of planetary protection.
NASA has an Office of Planetary Protection. The goal is to prevent Earth microbes from contaminating Mars and vise versa. This will become a growing concern for the space program when attempts are made to land humans on Mars or if a Mars sample return mission is sent. Drilling for water on Mars may expose an ancient subsurface biosphere, and certainly humans could carry Earth microbes to Mars. While the risks involved are still a matter of scientific debate, Wells was very prescient to include this factor in the War of the Worlds.
Regardless of what we discover about Mars in the next few decades, there was a deeper lesson in the original novel that tends to get lost in modern versions. The WKBW broadcast capped a night of Halloween themed programming and the primary goal was, as Orson Wells said to conclude his 1938 version, “Dressing up in a sheet, jumping out of a bush and saying, ‘Boo!”. H.G Wells had intended War of the Worlds as a critique of colonialism. Wells makes this clear on page three of the novel:
“And before we judge of them (Martians) too harshly we must remember what ruthless and utter destruction our own species has wrought, not only upon animals, such as the vanished bison and the dodo, but upon its inferior races. The Tasmanians, in spite of their human likeness, were entirely swept out of existence in a war of extermination waged by European immigrants, in the space of fifty years. Are we such apostles of mercy as to complain if the Martians warred in the same spirit?”
At the close of WKBW’s The War of the Worlds,Dan Neaverth asks the audience to think about what they would have done if the invasion was real. An equally important question to ask is what you would do if you were on the invading side. Would you join the invasion as the social forces of war coalesced around you, or would you resist the tide, as Bertrand Russell did in World War I:
“I knew it was my business to protest, however futile that protest might be. I felt that for the honour of human nature those who were not swept off their feet should show that they stood firm.”
That question, for those of us of a certain age, is associated most often with the garish 70’s singles scene. For teachers, it represents part of the struggle to educate students new to astronomy to disabuse the relationship between the location of the stars and planets with one’s personal future outlook. While a teacher might recoil in horror when an assignment is turned in with the heading Astrology 101, a student’s interest in astrology can be used to teach certain astronomy concepts. It is somewhat similar using science fiction in the classroom. After all, part of the purpose of education is to enable students to make conceptual leaps from myth to reality. And to do that, you have to meet the student on level ground.
Astrology is where many of us first learn of the constellations. There are 88 constellations that divide the celestial sphere in the same manner states divide a nation. However, astrology focuses on 12 zodiac constellations that lie in the ecliptic and form a background that the Sun and planets move through. The ecliptic is a narrow path in the sky that the Sun and planets travel from our perspective on Earth. As the Solar System formed 4.5 billion years ago, the solar nebula flattened causing the planets and Sun to coalesce in the same disk. Conceptually, it can be difficult to imagine the Sun and planets moving in the same path in the sky as we see them during different times (the Sun during the day and planets at night). A total solar eclipse does allow us to visualize this.
This is a simulation of the total eclipse to occur on April 8, 2024 in Buffalo. With the Sun’s light blocked by the Moon, you can see how the planets (in this case, Mercury, Venus, Mars, & Saturn) and Sun move along in the same path in the sky. And this path is called the ecliptic. You’ll also note two constellations in the ecliptic, Pisces and Aquarius, which correlate to astrological signs. This illustrates how the Sun lies in constellations just as the planets do. We typically do not get to visualize this as the Sun’s brightness does not allow us to see constellations during the day. This image demonstrates how the zodiac constellations align with the Earth and Sun during the year.
Credit: David Darling
The Sun will be located in the constellation opposite from Earth. Some caveats here, the month the Sun is located in a constellation will not match your astrological sign. Also, there actually is another constellation, Ophiuchus, that lies in the ecliptic but the ancient Babylonian astrologers decided to casually toss that one out as they were using a 12 month calendar. Noting that astrology has not kept up with the precession of the Earth’s axis the last few thousand years will hopefully be a first step in cracking any validity astrology may have with a student. Note in the eclipse image above the Sun resides in Pisces, but your astrological sign is Taurus if born on April 8th. Planetarium software such as Starry Night will allow the class to view the changing zodiac throughout time.
Retrograde Motion
Often referred to in astrology, retrograde motion pertains to a “backwards” motion of a planet in the ecliptic. Before the Copernicus revolution putting the Sun, instead of the Earth, at the center of the Solar System, retrograde motions confounded astronomers. Lets take a look at an example, Mars during 2016. The image below tracks Mars motion in the ecliptic from the beginning of 2016 to the end of September, 2016.
The retrograde or backwards motion of Mars occurs from April 17th to June 30th. What’s happening here? Earth and Mars are approaching opposition, an event that will take place on May 22, 2016. At this time, Mars and the Sun are on opposite sides of the Earth. This means on that date, Mars will rise in the east as the Sun sets in the west. As this is Mars closest approach to Earth, Mars is at its brightest. Opposition is the optimal time to observe a planet. In the case of Mars, impending opposition to Mars also represents launch windows for space agencies to send missions there. If the launch window is missed, the mission must wait another 26 months until the next opposition. So how does all this result in retrograde motion? This is when Earth “passes” Mars like a race car with an inside track passes a car on the outside. The resulting retrograde effect is visualized below:
Credit: NASA
Point d is when opposition occurs and is the midway point of the retrograde motion.
Conjunctions
As the planets all orbit the Sun in the same plane, sometimes they align in the same line of view to form a conjunction of planets. One such example will occur in the early morning hours of October 28th when Venus, Mars, or Jupiter will all be within a few degrees of each other. The scene will look like this:
These conjunctions serve as excellent teaching opportunities as it allows students to locate several planets at once quite easily. Below is an inner Solar System view of the event. Jupiter is not in the image but would be aligned right behind Mars if visible in this view:
From an planetary science perspective, conjunctions really do not have much to offer, but for the rest of us they can provide a really neat night time spectacle. These events are an excellent way to introduce the planets to those new to astronomy.
Zodiacal Light
I’ve never heard the zodiacal light mentioned in an astrological context but, while we are learning about the zodiac, now is as good as any time to familiarize ourselves with this. Besides the Sun, planets, and asteroids, the plane of ecliptic is occupied by cosmic dust. This dust is the remnants of comet tails and asteroid collisions. Best seen in dark sky locations, the zodiacal light is visible in the east just before sunrise or in the west just after sunset. This faint glow, which follows the ecliptic in the sky, is usually most observable in the Spring or Fall. During these seasons, the ecliptic has a steeper pitch relative to the horizon. Fainter than the Milky Way, most urban dwellers do not get the opportunity to see it. However, if you find yourself away from the city lights, this is what you can expect to see:
Zodiacal light from VLT in Chile Credit: ESO/Yuri Beletsky
Sagittarius
The Sun enters Sagittarius in mid-December and exits during mid-January. During the Summer months, the classic teapot of Sagittarius lies high in the night sky along with the Milky Way. In fact, the center of the Milky Way lies in Sagittarius. What this means is that each December, both the center of the Milky Way and the Sun are in Sagittarius. You might recall back in 2012, this alignment was, according to some less than reliable sources, going to result in the end of the world. Needless to say, as an annual event, this would have destroyed the Earth a whole lot sooner than 2012. That is the power of a liberal arts education, it clears a lot of silly stuff out of the way.
December 21, 2015 – The Sun and Milky Way center both reside in Sagittarius. Daylight was shut off on Starry Night software so both the Sun and constellation can be seen at the same time.
Speaking of which, although Sagittarian Jim Morrison gets it “right” about astrology here, you really should not need a celebrity to tell you what is useful information and what is not. And the audience is clearly going with whatever Morrison is telling them here. A liberal arts education provides a basic framework of knowledge to make up your own mind and not be concerned with looking cool or not with the results.
*Image on top of post is the painting of the 12 constellations of the Zodiac on the ceiling of the Grand Central Terminal in New York City. Infamously, the designer goofed and placed the constellations backwards. Photo: Gregory Pijanowski.
Every Thursday, the TBT theme pops up on social media and with it, many historical images. Those images tend to remind me of Jack Finney, who wrote several stories about time travel into the past. While Googling Jack Finney, I ended up taking a little peek into the past at one of my favorite websites during the nascent internet era of the 1990’s. The site has been down for several years, but I stumbled into a webpage that still had a link to it. The link didn’t work, of course, but it contained the old URL that I was able to plug into the Wayback Machine and viola!
This website was quite handy as it contained details on authors that were, well, little-known. At least on the internet anyway. It is difficult to describe how slow information traveled before the internet. And that difficulty extended to finding authors whose work would be of interest. Most of this kind of info was exchanged by word of mouth. In the case of Jack Finney, I heard of him via Stephen King’s book, DanseMacabre. King mentioned that Finney’s work was akin to The Twilight Zone, but executed better. That piqued my interest, and this being the late-eighties, I headed off to the downtown library to find some of Finney’s stories.
The library was essentially the internet before the internet. Finding something in a library was much more time consuming than going to Google, but the best libraries had an ambiance that was hard to surpass. That has changed with the advancement of technology. The central library where I live has converted the stacks on the 2nd floor to conference rooms. And much of the stacks on the main floor has been removed for, you guessed it, computers. Libraries, like the book industry itself, are adapting to the needs of the computer age.
Three decades ago, though, it was the place where I found Finney’s work. Among the classic time travel short stories were The Third Level and Second Chance. The theme would be expanded upon with the novel Time and Again. Finney’s work was not restricted to time travel. Home Alone chronicled the adventures of Charlie Burke in his homemade balloon some twenty years before Larry Walters aka Lawn Chair Larry. Some critics threw flak at these time travel stories, especially those that presented the 1890’s as an idyllic era. Finney would attempt to rectify that in Time and Again with descriptions of some of the drudgeries of life in 1894. Why would Finney have found a captive audience for 1890’s nostalgia?
It may seem preposterous to think of the 1890’s as an era one would want to escape into. Certainly, no one would want to be stuck in 1894 and require medical care. The 1890’s also featured a slow, grinding depression with five consecutive years of unemployment over 11% – in a time of no social safety net. Globally, much of the world’s population was subjugated to colonialism (Interestingly, life under colonialism is a theme of many of the authors on the Little-Known Literaries site). How could anyone consider trading in life in the 20th century for that?
Jack Finney was born in 1911. By the time Finney was in his mid-thirties, he had lived through two world wars and the Great Depression. The end of World War II would not bring much relief to societal anxiety as it heralded the dawn of the atomic age and the possible end of humanity with it. The future? Just two months after World War II concluded, Life Magazine outlined the possible future with an article called The Thirty-Six Hour War, complete with imagery of atomic bombs raining down on the United States and life in bomb shelters. Taking a gander at that Life article, it’s no wonder some preferred to read escapist fare such as Finney’s work.
The theory of relativity had also taken hold in the public imagination. Einstein himself said, “The distinction between the past, present and future is only a stubbornly persistent illusion.” This idea of time as a fluid entity gave Finney the perfect portal to present this concept as a dramatic device. To be sure, the methods of time travel Finney used were sheer fantasy, not pertaining to Einstein’s work at all where time travel to the past is very problematic at best.
Finney often used a technique where a character surrounded himself with artifacts from the period to travel to and self-hypnosis to make the leap into an earlier era. The movie Somewhere in Time uses this procedure as Christopher Reeves makes the leap back into the 1890’s. While not written by Finney, Somewhere in Time was clearly inspired by his work. Silly? Perhaps, but Finney’s story telling abilities allowed him to pull it off. I’ve wondered if Finney was inspired by his many research trips to the Mill Valley library where he resided. The first time I read the Life article on the 36 hour war was not on Google, or on microfilm, but in a library that had the complete history of real Life magazines bounded in the open stacks. It can be a remarkable experience to read historical publications in the same media the inhabitants of that era did.
And that brings me back to the Little-Known Literaries website I found again this week. Looking at it now, it might seem a bit rudimentary. During the 1990’s, the main form of accessing the internet was through 56 kbps dial-up. That precluded any intensive graphics or videos. The website, like many of that era, had a repeating image as its background. Designed in 1996 as part of a graduate school project, most likely HTML was used. As I write this post, I have the luxury of using a WordPress template which is comparable to using a Word doc. To appreciate what working with HTML is like, this is how the first paragraph of this post appears in that language:
What is also missing are spammy banner ads, dreadful comments sections, and misinformation. Reading the website as it existed in the 1990’s was quite similar to reading the original Life magazines that, you guessed it, have been since moved into the closed stacks of the library.
The Little-Known Literaries delivered as intended. Information on authors and their work, along with other like-minded writers the reader may be interested in. Leah Sparks wrote the section on Jack Finney and maintained the site for about a decade. While the Little-Known Literaries website was nominally a grad school project, it was obviously a labor of love as well. And that’s worth remembering, whether it is 1894, 1996, or 2015.
*Image on top of post is the Holmes Building, 152 E. Main St. in Galesburg, IL, 1899. Jack Finney attended Knox College in Galesburg and used the town as a setting for several of his time travel stories. Credit: Galesburg Public Library.